A subscription to JoVE is required to view this content.  Sign in or start your free trial.
Magnetic Activated Cell Sorting (MACS): Isolation of Thymic T Lymphocytes
  • 00:03Concepts
  • 02:33Preparation of Materials and Dissection
  • 03:39Immune Cell Isolation
  • 05:22Magnetic Labeling of Immune Cells
  • 06:59Magnetic Separation of CD3-Positive Cells
  • 07:48Evaluation of Target-Cell Enrichment by Flow Cytometry
  • 09:00Data Analysis

Magnetaktivierte Zellsortierung (MACS): Isolierung von T-Lymphozyten

English

Share

Overview

Quelle: Meunier Sylvain1,2,3, Perchet Thibaut1,2,3, Sophie Novault4, Rachel Golub1,2,3
1 Einheit für Lymphopoiese, Institut für Immunologie, Pasteur Institute, Paris, Frankreich
2 INSERM U1223, Paris, Frankreich
3 Université Paris Diderot, Sorbonne Paris Cité, Cellule Pasteur, Paris, Frankreich
4 Flow Cytometry Platfrom, Cytometry and Biomarkers UtechS, Center for Translational Science, Pasteur Institute, Paris, Frankreich

Die Abwehr von Krankheitserregern hängt von der Überwachung durch das Immunsystem ab. Dieses System ist komplex und umfasst viele Zelltypen, von denen jeder spezifische Funktionen hat. Diese komplexe Zusammensetzung ermöglicht Immunreaktionen auf eine große Vielfalt von Krankheitserregern und Verletzungen. Die adaptive Immunität ermöglicht spezifische Reaktionen gegen bestimmte Krankheitserreger. Die Mehrheit der Zellen, die für diese Art der Immunität verantwortlich sind, sind die Lymphozyten (B-Zellen und T-Zellen). In der Regel reagieren B-Zellen auf extrazelluläre Infektionen (z. B. bakterielle Infektionen) und T-Zellen auf intrazelluläre Infektionen (z. B. Virusinfektionen). Die verschiedenen Zelltypen in Lymphozytenpopulationen können durch die Kombination von Zelloberflächenproteinen, die sie exprimieren, und/oder durch eine Gruppe von abgesonderten Zytokinen charakterisiert werden.

Die magnetische Sortierung ermöglicht die Anreicherung von Zielzellpopulationen unter Verwendung magnetischer Eigenschaften und expressionierung eines oder mehrerer Zelloberflächenproteine (1, 2). Diese Technik besteht aus drei Schritten. Zunächst werden die Zellen mit magnetischen Perlen inkubiert, die mit einem oder mehreren monoklonalen Antikörpern gekoppelt sind. Zellen, die Oberflächenproteine ausdrücken, die an diese Antikörper binden, heften sich an die magnetischen Perlen. Dann werden die Zielzellpopulationen mit einem Magneten erfasst. Zum Abschluss werden die Zielzellen vom Magneten eluiert. Am Ende werden zwei Sortierprodukte erhalten, eines mit nicht beschrifteten Zellen und das zweite mit den Zielzellen gekoppelt mit den Magnetperlen. Säulen können verwendet werden, um die Effizienz der magnetischen Sortierung zu verbessern. In der Spalte verlängert ein nichtmagnetisches Element den Pfad der Zelle durch die Spalte. Daher wird der Zellfluss verlangsamt, was die Zellerfassung durch den Magneten erleichtert.

Figure 1
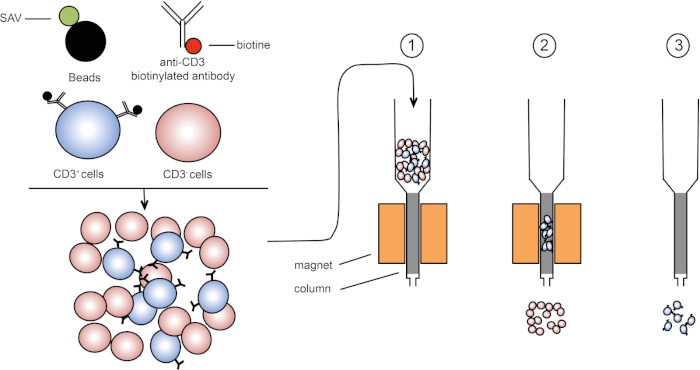
Abbildung 1: Schematische Darstellung der magnetischen Trennung. Thymische Leukozyten sind mit Anti-CD3-biotinylierten Antikörpern gefärbt. Nach dem Waschen fixieren Streptavidin (SAV) gekoppelte Perlen das Biotin gezielt auf Anti-CD3-Antikörper. (1) Zellen werden in eine Spalte übertragen. (2) Der Magnet behält keine unbeschrifteten Zellen, während CD3-positive Zellen in der Spalte verbleiben. Schließlich wird die Säule vom Magneten getrennt und (3) CD3-positive Zellen werden im Medium eluiert. Bitte klicken Sie hier, um eine größere Version dieser Abbildung anzuzeigen.

Es gibt zwei Arten der magnetischen Sortierung (3). Bei der positiven Sortierung werden Von interessede Zellen mit den Magnetperlen erfasst. Bei der negativen Sortierung werden unerwünschte Zellen entfernt, indem sie mit den magnetischen Perlen, die die entsprechenden Antikörper tragen, aufgenommen werden. Diese MACS-Technik ermöglicht eine gute Anreicherung von Zielzellen und verbessert den Anteil der zurückgewonnenen Zellen von 1-20% auf 60-98% in einem Organ. Nach der Sortierung ist es notwendig, die Zellreinheit und die Sortierung nach verschiedenen Methoden (z.B. Durchflusszytometrie) zu überprüfen. Die MACS-Technik ist ideal, um eine Zielpopulation für andere Experimente wie Zellkultur oder Zellzyklusanalyse zu bereichern.

In dieser Übungseinheit zeigen wir, wie thymische Leukozyten isoliert und anschließend thymische CD3-positive Zellen aus dem Mix mit der magnetischen Zellsortierungstechnik angereichert werden können.

Procedure

1. Vorbereitung Vor Beginn Laborhandschuhe und entsprechende Schutzkleidung anziehen. Waschen Sie alle Sezierwerkzeuge, zuerst mit einem Waschmittel und dann mit 70% Ethanol und trocknen Sie sie dann mit einem sauberen Papiertuch. Bereiten Sie 200 ml von Hanks ausgewogener Salzlösung (HBSS) vor, die 2% fetales Kalbsserum (FCS) enthält. 2. Dissektion Pin eine eingeschläferte Maus auf eine Sezierplatte in der Supi…

Results

In this protocol, CD3-positive cells were enriched from thymic leukocytes using magnetic cell sorting (Figure 1). Before magnetic cell enrichment CD3-positive cells represented 53.6% of the total thymic cells (Figure 2, top panels). After magnetic cell enrichment the percentage of CD3-positive cells increased to 95% (Figure 2, bottom panels). Thus, MACS is a simple, fast and efficient cell enrichment technique to enrich desired cell populations from a cell suspension mixture.

Figure 2
Figure 2: Gating strategy and purity test sorting. Cells are first gated based on their morphology (left: FSC-A, SSC-A), and then cells are plotted against CD3 (right: CD3, SSC-A). Top panel represents thymus cell suspension before cell enrichment. Bottom panel represents thymus cell suspension after magnetic cell sorting. Please click here to view a larger version of this figure.

Applications and Summary

Magnetic separation technology is a common method to easily and rapidly sort a target cell population. Using T cells specific antibodies and magnetic beads we enriched T cells frequency in our sample. The purity rate at the end of the experiment depends of the percentage of target cells in the initial cell suspension. Cells obtained after magnetic cell sorting can be used for various purposes such as- cell transfer or cell cycle analysis. Another sorting method, using flow cytometry, can be used to enrich cells. This technique yields have a very high purity rate after cell sorting however it requires more steps and takes more time.

References

  1. Owen, C. S. and Sykes, N. L. Magnetic labeling and cell sorting. Journal of Immunological Methods. 73 (1), 41-48 (1984).
  2. Miltenyi, S., Müller, W., Weichel, W. and Radbruch, A. High gradient magnetic cell separation with MACS. Cytometry. 11 (2), 231-238 (1990).
  3. Plouffe, B. D., Murthy, S. K. and Lewis, L. H. Fundamentals and application of magnetic particles in cell isolation and enrichment: a review. Reports on Progress in Physics. 78 (1), (2014).

Transcript

Magnetic-activated cell sorting, or MACS, is a technique that allows researchers to separate cells based on specific epitopes expressed on their surfaces.

The process typically begins with extraction of an organ or tissue, such as the thymus. Then, the cells are mechanically separated, usually by crushing, until the tissue is dissociated into single cells. Unwanted cells can be removed at this stage via the addition of chemicals. For example, ammonium-chloride-potassium, or ACK buffer, can be used to lyse unwanted erythrocytes.

Next, an antibody conjugated to a molecule called biotin is added to the suspension, and these complexes bind to the epitopes of the surface of the target cells. Biotin has a high affinity for another molecule called streptavidin. In the next step, streptavidin molecules fused to magnetic beads are added to the antibody labeled cells. When the biotin and streptavidin come into contact, they tightly bind. The result is that the cells of interest are coated with magnetic beads. This complex is sometimes referred to as a sandwich. In this case, CD3 on the cell membrane on the bottom, then anti-CD3 conjugated to biotin, and finally, streptavidin conjugated to magnetic beads.

These labeled cells can now be placed into a column containing a matrix which, assisted by gravity, allows the cells to pass slowly by a magnet. As they do so, the magnetic bead-labeled cells will stick to the edge of the tube nearest the magnet, while the non-labeled cells will continue on into a collection tube below. Next, the labeled cells can be removed from the column by simply removing the magnet, adding an eluent solution, and applying gentle pressure with a plunger to flush them out of the column and into a fresh collection tube. Ultimately, this process allows for 60 to 98% retrieval of the cells of interest.

In this procedure, we will isolate thymic leukocytes from a mouse and use MACS to sort out CD3-positive T-cells before confirming the efficiency of sorting using FACS.

To begin, put on any appropriate protective equipment including a lab coat and gloves. Next, wash a pair of dissecting scissors and forceps with 70% ethanol and dry them with a clean paper towel. Then prepare 200 milliliters of HBSS 2% fetal calf serum, or FCS, by mixing four milliliters of FCS with 196 milliliters of HBSS.

Pin a euthanized mouse in a supine position on a dissection plate. Using scissors and forceps, perform a longitudinal laparotomy to access the chest cavity. First, remove the heart to gain access to the thymus, which is located above the heart. Then identify the thymus, which is composed of two white lobes. Using forceps, carefully detach the thymus and place it on a Petri dish with five milliliters of HBSS 2% FCS.

To isolate the immune cells, first place the thymus on a 40 micrometer cell strainer in the Petri dish. Crush the tissue with a plunger to dissociate it into the dish. After this, rinse the plunger and strainer with HBSS 2% FCS to recover any adhered cells. Then, pipette the dissociated thymus cells and fluid from the Petri dish into a 15 milliliter centrifuge tube. Wash the Petri dish with five milliliters of HBSS 2% FCS and transfer this wash solution to the 15 milliliter centrifuge tube also.

Next, centrifuge the tube at 370 times g for seven minutes at 20 degrees Celsius. Discard the supernatant and resuspend the pellet in two milliliters of ACK lysing buffer to lyse the erythrocytes. Incubate for two minutes at room temperature on the bench top. Then, bring the volume to 14 milliliters with HBSS 2% FCS. Centrifuge the tube at 370 times g for seven minutes at 20 degrees Celsius. Then, discard the supernatant and resuspend the cells in five milliliters of HBSS 2% FCS.

Estimate the cell concentration using a Malassez slide as shown in the protocol for FACS isolation of B lymphocytes and adjust the cell concentration to 10 to the seventh cells per milliliter with HBSS 2% FCS.

Transfer 500 microliters of cell solution into two FACS tubes. Label one tube non-enriched T-cells and the other tube enriched T-cells, which will be separated using magnetic labeling.

Centrifuge the enriched T-cells tube at 370 times g for three minutes at 20 degrees Celsius. Discard the supernatant and resuspend the pellet in 250 microliters of biotin coupled anti CD3 antibody diluted one in 400 in HBSS 2% FCS. Incubate the cells for 20 minutes on ice and in the dark. Add three milliliters of HBSS 2% FCS to the tubes and centrifuge them again at 370 times g for three minutes at 20 degrees Celsius. Discard the supernatant and resuspend the pellet in 250 microliters of streptavidin-coupled beads diluted one in five in HBSS 2% FCS. Incubate the mixture of cells and beads for 20 minutes on ice. Next, add three milliliters of HBSS 2% FCS to the tube, pipette up and down to mix, and centrifuge again at 370 times g for three minutes at 20 degrees Celsius. Resuspend the pellet in two milliliters of HBSS 2% FCS.

Place the column on the magnet and add three milliliters of HBSS 2% FCS to humidify the system. Then, pipette the stained cells into the column. After the cell suspension passes through the column, wash the column three times with three milliliters of HBSS 2% FCS. Next, remove the column from the magnet and place it in a 15 milliliter tube. To elute the target cells, add five milliliters of HBSS 2% FCS to the column and flush the column with a plunger. Repeat this step with another five milliliters of HBSS 2% FCS.

To evaluate the effectiveness of target cell isolation, first transfer 500 microliters of eluted cell suspension to a FACS tube and label it enriched T-cells. Then, centrifuge both the enriched and non-enriched tubes at 370 times g for seven minutes at 20 degrees Celsius. Discard the supernatant, then add 100 microliters of fluorescent antibody diluted one in 200 in HBSS 2% FCS to both tubes. Incubate the cells for 20 minutes on ice and in the dark. Next, add three milliliters of HBSS 2% FCS to the tubes and centrifuge them at 370 times g for three minutes at 20 degrees Celsius. Discard the supernatant, then resuspend the pellets in 250 microliters of HBSS 2% FCS. Now, evaluate the CD3-positive cell enrichment rate using flow cytometry as shown in the FACS protocol.

Now, we will determine the frequency of CD3-positive lymphocytes among all thymocytes that were isolated from the mouse thymus. To start, double click on the FlowJo icon and drag the files for each tube in the all sample window. Then, double click on the enriched T-cells file to display the cells recorded from that sample on a dot plot that displays forward scatter, FSCA, on the x-axis, and side scatter, SSCA, on the y-axis.

Click on polygon to circle the lymphocyte populations. Next, double click on the circled population to create a new window. Select FSC-W on the y-axis, and FSC-A on the x-axis and circle the FSA-W negative cells. In the sub population identification window, name your cell population Single Cells. Next, click on OK on the sub population identification window, then double click on the circled population to create a new window. Select CD3 on the y-axis, and circle the CD3-positive cells. In the sub population identification window, name your cell population T-cells. Repeat with the non-enriched T-cells file. To visualize your cell population, click Layout Editor and drag the T-cell population from enriched T-cells and non-enriched T-cells files into the tab.

Dot plots representing CD3-positive lymphocytes will appear. CD3-positive cells should only appear in the population of interest in the CD3-positive enriched tube. To evaluate the enrichment of CD3-positive lymphocytes in the sorted cells, click on Table Editor and then drag the T-cells population from enriched T-cells and non-enriched T-cells files into the table. On the statistic menu, select Frequency of Lymphocyte Cells to check the percentage of CD3-positive cells in all lymphocytes. Then, click on Create Table. Parameter values will appear in a new table. For the enriched T-cells, the frequency of CD3-positive cells should be around 80% or above.

Tags

Cite This
JoVE Science Education Database. JoVE Science Education. Magnetic Activated Cell Sorting (MACS): Isolation of Thymic T Lymphocytes. JoVE, Cambridge, MA, (2023).