A subscription to JoVE is required to view this content.  Sign in or start your free trial.
Magnetic Activated Cell Sorting (MACS): Isolation of Thymic T Lymphocytes
  • 00:03Concepts
  • 02:33Preparation of Materials and Dissection
  • 03:39Immune Cell Isolation
  • 05:22Magnetic Labeling of Immune Cells
  • 06:59Magnetic Separation of CD3-Positive Cells
  • 07:48Evaluation of Target-Cell Enrichment by Flow Cytometry
  • 09:00Data Analysis

Seleção de Células Ativadas por Magnetismo (MACS): Isolamento de Linfócitos T Tímicos

English

Share

Overview

Fonte: Meunier Sylvain1,2,3, Perchet Thibaut1,2,3, Sophie Novault4, Rachel Golub1,2,3
1 Unidade de Linfopose, Departamento de Imunologia, Instituto Pasteur, Paris, França
2 INSERM U1223, Paris, França
3 Université Paris Diderot, Sorbonne Paris Cité, Cellule Pasteur, Paris, França
4 Flow Cytometry Platfrom, Cytometry and Biomarkers UtechS, Center for Translational Science, Pasteur Institute, Paris, França

A defesa contra patógenos depende da vigilância do sistema imunológico. Este sistema é complexo e compreende muitos tipos de células, cada uma com funções específicas. Essa composição complexa permite respostas imunes a uma grande diversidade de patógenos e lesões. A imunidade adaptativa permite respostas específicas contra patógenos específicos. A maioria das células responsáveis por esse tipo de imunidade são os linfócitos (células B e células T). Geralmente, as células B respondem a infecções extracelulares (como infecções bacterianas), e as células T respondem a infecções intracelulares (como infecções virais). Os diferentes tipos de células em populações de linfócitos podem ser caracterizados pela combinação de proteínas de superfície celular que expressam e/ou por um painel de citocinas secretadas.

A classificação magnética permite o enriquecimento de populações de células-alvo usando propriedades magnéticas e expressão de uma ou várias proteínas da superfície celular (1, 2). Esta técnica consiste em três passos. Primeiro, as células são incubadas com contas magnéticas que são acopladas a um ou vários anticorpos monoclonais específicos. Células que expressam proteínas superficiais que se ligam a esses anticorpos se prendem às contas magnéticas. Então, as populações de células-alvo são capturadas com um ímã. Para terminar, as células-alvo são eluidas do ímã. No final, são obtidos dois produtos de triagem, um contendo células não rotuladas e o segundo contendo as células-alvo, juntamente com as contas magnéticas. Colunas podem ser usadas para melhorar a eficiência da classificação magnética. Na coluna, um elemento não magnético alonga o caminho da célula através da coluna. Assim, o fluxo celular é desacelerado, facilitando a captura celular pelo ímã.

Figure 1
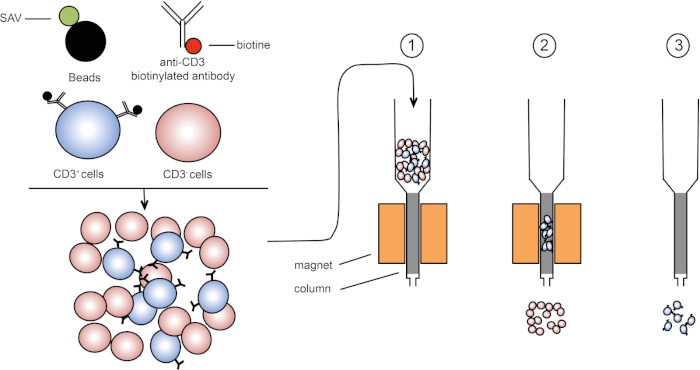
Figura 1: Representação esquemática da separação magnética. Leucócitos timimicos estão manchados com anticorpos biotinilados anti-CD3. Após a lavagem, streptavidin (SAV) acoplado contas especificamente fixam a biotina em anticorpos anti-CD3. (1) As células são transferidas em uma coluna. (2) O ímã não retém células não rotuladas, enquanto as células CD3 positivas permanecem na coluna. Finalmente, a coluna é separada do ímã e (3) células CD3 positivas são elucidadas em média. Clique aqui para ver uma versão maior desta figura.

Existem dois tipos de classificação magnética (3). Em classificação positiva, células de interesse são capturadas com as contas magnéticas. Na classificação negativa, as células indesejadas são removidas capturando com as contas magnéticas carregando os anticorpos apropriados. Esta técnica macs permite um bom enriquecimento de células-alvo e melhora a porcentagem de células recuperadas de 1-20% para 60-98% em um órgão. Após a triagem, é necessário verificar a pureza celular e a classificação por diferentes métodos (por exemplo, citometria de fluxo). A técnica MACS é ideal para enriquecer uma população-alvo para outros experimentos, como cultura celular ou análise de ciclo celular.

Neste exercício de laboratório, demonstramos como isolar leucócitos timiços e, posteriormente, enriquecer células timmicas CD3 positivas da mistura usando a técnica de classificação celular magnética.

Procedure

1. Preparação Antes de começar, coloque luvas de laboratório e roupas de proteção apropriadas. Lave todas as ferramentas de dissecção, primeiro com um detergente e depois com 70% de etanol e depois seque-as com uma toalha de papel limpa. Prepare 200 mL da solução de sal balanceada da Hank (HBSS) contendo 2% de soro fetal de bezerro (FCS). 2. Dissecção Fixar um rato eutanizado em uma placa de dissecção…

Results

In this protocol, CD3-positive cells were enriched from thymic leukocytes using magnetic cell sorting (Figure 1). Before magnetic cell enrichment CD3-positive cells represented 53.6% of the total thymic cells (Figure 2, top panels). After magnetic cell enrichment the percentage of CD3-positive cells increased to 95% (Figure 2, bottom panels). Thus, MACS is a simple, fast and efficient cell enrichment technique to enrich desired cell populations from a cell suspension mixture.

Figure 2
Figure 2: Gating strategy and purity test sorting. Cells are first gated based on their morphology (left: FSC-A, SSC-A), and then cells are plotted against CD3 (right: CD3, SSC-A). Top panel represents thymus cell suspension before cell enrichment. Bottom panel represents thymus cell suspension after magnetic cell sorting. Please click here to view a larger version of this figure.

Applications and Summary

Magnetic separation technology is a common method to easily and rapidly sort a target cell population. Using T cells specific antibodies and magnetic beads we enriched T cells frequency in our sample. The purity rate at the end of the experiment depends of the percentage of target cells in the initial cell suspension. Cells obtained after magnetic cell sorting can be used for various purposes such as- cell transfer or cell cycle analysis. Another sorting method, using flow cytometry, can be used to enrich cells. This technique yields have a very high purity rate after cell sorting however it requires more steps and takes more time.

References

  1. Owen, C. S. and Sykes, N. L. Magnetic labeling and cell sorting. Journal of Immunological Methods. 73 (1), 41-48 (1984).
  2. Miltenyi, S., Müller, W., Weichel, W. and Radbruch, A. High gradient magnetic cell separation with MACS. Cytometry. 11 (2), 231-238 (1990).
  3. Plouffe, B. D., Murthy, S. K. and Lewis, L. H. Fundamentals and application of magnetic particles in cell isolation and enrichment: a review. Reports on Progress in Physics. 78 (1), (2014).

Transcript

Magnetic-activated cell sorting, or MACS, is a technique that allows researchers to separate cells based on specific epitopes expressed on their surfaces.

The process typically begins with extraction of an organ or tissue, such as the thymus. Then, the cells are mechanically separated, usually by crushing, until the tissue is dissociated into single cells. Unwanted cells can be removed at this stage via the addition of chemicals. For example, ammonium-chloride-potassium, or ACK buffer, can be used to lyse unwanted erythrocytes.

Next, an antibody conjugated to a molecule called biotin is added to the suspension, and these complexes bind to the epitopes of the surface of the target cells. Biotin has a high affinity for another molecule called streptavidin. In the next step, streptavidin molecules fused to magnetic beads are added to the antibody labeled cells. When the biotin and streptavidin come into contact, they tightly bind. The result is that the cells of interest are coated with magnetic beads. This complex is sometimes referred to as a sandwich. In this case, CD3 on the cell membrane on the bottom, then anti-CD3 conjugated to biotin, and finally, streptavidin conjugated to magnetic beads.

These labeled cells can now be placed into a column containing a matrix which, assisted by gravity, allows the cells to pass slowly by a magnet. As they do so, the magnetic bead-labeled cells will stick to the edge of the tube nearest the magnet, while the non-labeled cells will continue on into a collection tube below. Next, the labeled cells can be removed from the column by simply removing the magnet, adding an eluent solution, and applying gentle pressure with a plunger to flush them out of the column and into a fresh collection tube. Ultimately, this process allows for 60 to 98% retrieval of the cells of interest.

In this procedure, we will isolate thymic leukocytes from a mouse and use MACS to sort out CD3-positive T-cells before confirming the efficiency of sorting using FACS.

To begin, put on any appropriate protective equipment including a lab coat and gloves. Next, wash a pair of dissecting scissors and forceps with 70% ethanol and dry them with a clean paper towel. Then prepare 200 milliliters of HBSS 2% fetal calf serum, or FCS, by mixing four milliliters of FCS with 196 milliliters of HBSS.

Pin a euthanized mouse in a supine position on a dissection plate. Using scissors and forceps, perform a longitudinal laparotomy to access the chest cavity. First, remove the heart to gain access to the thymus, which is located above the heart. Then identify the thymus, which is composed of two white lobes. Using forceps, carefully detach the thymus and place it on a Petri dish with five milliliters of HBSS 2% FCS.

To isolate the immune cells, first place the thymus on a 40 micrometer cell strainer in the Petri dish. Crush the tissue with a plunger to dissociate it into the dish. After this, rinse the plunger and strainer with HBSS 2% FCS to recover any adhered cells. Then, pipette the dissociated thymus cells and fluid from the Petri dish into a 15 milliliter centrifuge tube. Wash the Petri dish with five milliliters of HBSS 2% FCS and transfer this wash solution to the 15 milliliter centrifuge tube also.

Next, centrifuge the tube at 370 times g for seven minutes at 20 degrees Celsius. Discard the supernatant and resuspend the pellet in two milliliters of ACK lysing buffer to lyse the erythrocytes. Incubate for two minutes at room temperature on the bench top. Then, bring the volume to 14 milliliters with HBSS 2% FCS. Centrifuge the tube at 370 times g for seven minutes at 20 degrees Celsius. Then, discard the supernatant and resuspend the cells in five milliliters of HBSS 2% FCS.

Estimate the cell concentration using a Malassez slide as shown in the protocol for FACS isolation of B lymphocytes and adjust the cell concentration to 10 to the seventh cells per milliliter with HBSS 2% FCS.

Transfer 500 microliters of cell solution into two FACS tubes. Label one tube non-enriched T-cells and the other tube enriched T-cells, which will be separated using magnetic labeling.

Centrifuge the enriched T-cells tube at 370 times g for three minutes at 20 degrees Celsius. Discard the supernatant and resuspend the pellet in 250 microliters of biotin coupled anti CD3 antibody diluted one in 400 in HBSS 2% FCS. Incubate the cells for 20 minutes on ice and in the dark. Add three milliliters of HBSS 2% FCS to the tubes and centrifuge them again at 370 times g for three minutes at 20 degrees Celsius. Discard the supernatant and resuspend the pellet in 250 microliters of streptavidin-coupled beads diluted one in five in HBSS 2% FCS. Incubate the mixture of cells and beads for 20 minutes on ice. Next, add three milliliters of HBSS 2% FCS to the tube, pipette up and down to mix, and centrifuge again at 370 times g for three minutes at 20 degrees Celsius. Resuspend the pellet in two milliliters of HBSS 2% FCS.

Place the column on the magnet and add three milliliters of HBSS 2% FCS to humidify the system. Then, pipette the stained cells into the column. After the cell suspension passes through the column, wash the column three times with three milliliters of HBSS 2% FCS. Next, remove the column from the magnet and place it in a 15 milliliter tube. To elute the target cells, add five milliliters of HBSS 2% FCS to the column and flush the column with a plunger. Repeat this step with another five milliliters of HBSS 2% FCS.

To evaluate the effectiveness of target cell isolation, first transfer 500 microliters of eluted cell suspension to a FACS tube and label it enriched T-cells. Then, centrifuge both the enriched and non-enriched tubes at 370 times g for seven minutes at 20 degrees Celsius. Discard the supernatant, then add 100 microliters of fluorescent antibody diluted one in 200 in HBSS 2% FCS to both tubes. Incubate the cells for 20 minutes on ice and in the dark. Next, add three milliliters of HBSS 2% FCS to the tubes and centrifuge them at 370 times g for three minutes at 20 degrees Celsius. Discard the supernatant, then resuspend the pellets in 250 microliters of HBSS 2% FCS. Now, evaluate the CD3-positive cell enrichment rate using flow cytometry as shown in the FACS protocol.

Now, we will determine the frequency of CD3-positive lymphocytes among all thymocytes that were isolated from the mouse thymus. To start, double click on the FlowJo icon and drag the files for each tube in the all sample window. Then, double click on the enriched T-cells file to display the cells recorded from that sample on a dot plot that displays forward scatter, FSCA, on the x-axis, and side scatter, SSCA, on the y-axis.

Click on polygon to circle the lymphocyte populations. Next, double click on the circled population to create a new window. Select FSC-W on the y-axis, and FSC-A on the x-axis and circle the FSA-W negative cells. In the sub population identification window, name your cell population Single Cells. Next, click on OK on the sub population identification window, then double click on the circled population to create a new window. Select CD3 on the y-axis, and circle the CD3-positive cells. In the sub population identification window, name your cell population T-cells. Repeat with the non-enriched T-cells file. To visualize your cell population, click Layout Editor and drag the T-cell population from enriched T-cells and non-enriched T-cells files into the tab.

Dot plots representing CD3-positive lymphocytes will appear. CD3-positive cells should only appear in the population of interest in the CD3-positive enriched tube. To evaluate the enrichment of CD3-positive lymphocytes in the sorted cells, click on Table Editor and then drag the T-cells population from enriched T-cells and non-enriched T-cells files into the table. On the statistic menu, select Frequency of Lymphocyte Cells to check the percentage of CD3-positive cells in all lymphocytes. Then, click on Create Table. Parameter values will appear in a new table. For the enriched T-cells, the frequency of CD3-positive cells should be around 80% or above.

Tags

Cite This
JoVE Science Education Database. JoVE Science Education. Magnetic Activated Cell Sorting (MACS): Isolation of Thymic T Lymphocytes. JoVE, Cambridge, MA, (2023).