The accuracy of metabolomics data highly depends on the LC-QE-MS instrument performance. To assess whether the instrument is operating in good condition, and whether the method applied is proper, several known metabolite LC peaks are extracted from the total ion chromatography (TIC), as shown in Figure 1. Polar metabolites, including amino acids, glycolysis intermediates, TCA intermediates, nucleotides, vitamins, ATP, NADP+ and so on have good retention on the column and good peak shapes in the amide column under current LC conditions. Meanwhile, a mass error test is done within 24 hr after low mass calibration, as illustrated in Figure 2. 6 different concentrations of samples in triplicate are run twice after calibration, and the whole time range covers almost 24 hr. The mass error is assessed by comparing the detected m/z to the theoretical m/z of targeted metabolites. Here the targeted metabolites have an m/z ranging from 74 (glycine) to 744 (NADP+). The Y axis here represents the accumulative percentage of metabolites within certain mass error range. The blue curve shows the result from 0-12 hr, while the red colored curve shows the data collected from 12-24 hr. Figure 2 clearly indicates that more than 90% of metabolites are within 5 ppm mass error, which means the low mass range calibration method developed here is sufficient to maintain 5 ppm mass error for low mass range detection.
Another issue to be addressed is the sensitivity of the instrument with the current method and instrument setup. A serial dilution of triplicate samples from 10 cm Petri dish was done 5 times with a dilution factor of 6, ending up with 6 different concentrations of samples. These samples represent the amount of metabolites extracted from 107, 1.67 x 10⁶, 2.78 x 10⁵, 4.63 x 10⁴, 7.72 x 10³, and 1.29 x 10³ of cells, respectively. Since each concentration of sample is prepared in triplicate, a total of 18 samples are analyzed in LC-QE-MS. A targeted list is used to assess the number of metabolites detected at for differing concentration of sample. The result in Figure 3 indicates that the optimal number of targeted metabolites detected is between 2.78 x 10⁵ and 1.67 x 10⁶ cells, while 1 x 10⁷ cells give a fewer number of detected metabolites, which is due to ion suppression effects. This result indicates that the optimal amount of cells to extract for this analysis is roughly that of a well of in a 6-well plate.
For untargeted metabolite analysis, a CV cutoff of 20% and an average intensity value of 107 are used to filter the components table. These rigid CV and average intensity threshold values are used for this demonstration aim. To improve reproducibility, CV cutoff values can be increased (for example, 30%) while the average intensity values need to be decreased (for example, 105) to include more peaks. After manually checking peaks, components with good shapes are selected and searched for in the human metabolome database. The results are shown in Table 2. Table 2A lists the results from data collected in positive mode, while Table 2B shows the results from negative mode. Some of the metabolites identified here overlap with the metabolites in the targeted list, such as glutathione, proline and so on, but meanwhile, additional metabolites absent from the targeted list are explored, such as methyglyoxal, which can be derived from glycolysis, and 1-palmitoyl-2-oleoyl-sn-glycero-3-phosphocholine, which is detected in positive with a retention time of 3.2 min, which is a reasonable retention for phospholipids on an amide column. A protocol on untargeted metabolite database searching has been previously reported20.

Figure 1. Examples of LC-MS chromatography peaks. Here, the reconstructed chromatography is generated with a mass window of 10 ppm (m/z ± 5 ppm). The X axis shows the retention time, while the Y axis shows the relative intensity, and the peak intensity is listed above every metabolite. A shows peaks detected from positive mode, while B shows peaks from negative mode. Click here to view larger image.
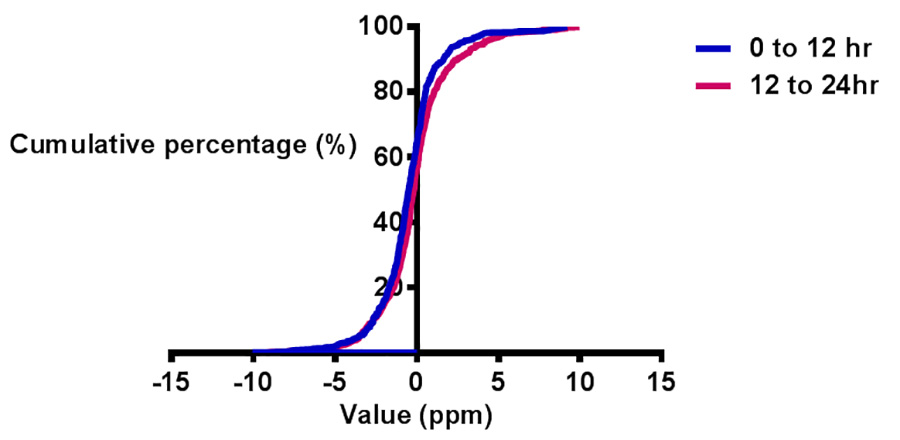
Figure 2. Evaluation of low mass range calibration. The Y axis is the cumulative percentage of metabolites with mass detection error within 5 ppm. The X axis is the mass error range in ppm. Blue and red curves represent 0-12 hr and 12-24 hr, respectively. Click here to view larger image.
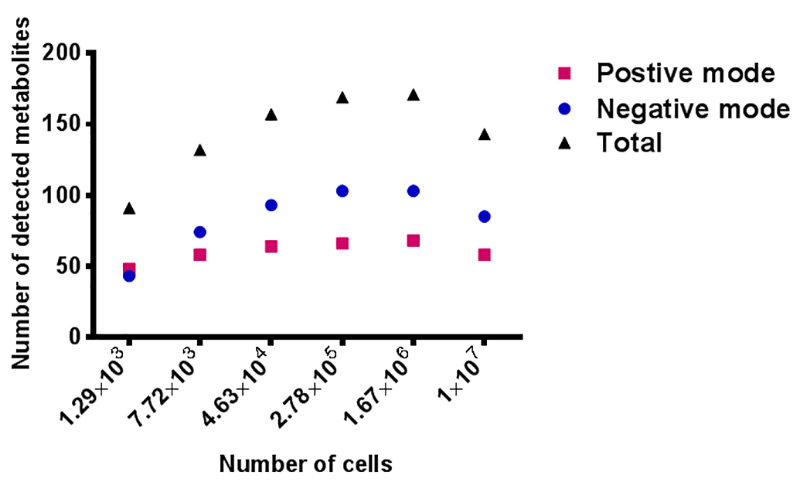
Figure 3. Evaluation of sample amount – number of targeted metabolites detected versus number of HCT 8 cells. Red squares represent metabolites detected in positive mode, blue circles mean metabolites measured in negative mode, and the black triangles are the total numbers of metabolites from both positive and negative mode. The X axis shows the number of HCT 8 cells. Click here to view larger image.
| Standards | M/Z, positive mode | M/Z, negative mode | Neutral formula | Neutral mass |
| n-Butylamine | 74.096425 | NA | C4H11N | 73.089149 |
| Caffeine fragment | 138.066188 | NA | C6H8N3O | 137.058912 |
| Caffeine | 195.087652 | NA | C8H11N4O2 | 194.080376 |
| Diazinon | 305.108329 | NA | C12H20N2O3PS | 304.101053 |
| MRFA peptide | 524.264966 | NA | C23H37N7O5S | 523.25769 |
| Fluoroacetate | N/A | 77.004432 | C2H3FO2 | 78.011708 |
| Sulfate | N/A | 96.960106 | H2SO4 | 97.967382 |
| Homovanillic acid | N/A | 181.050634 | C9H10O4 | 182.05791 |
| Dodecyl sulfate | N/A | 265.147906 | C12H26SO4 | 266.155182 |
| Taurocholate | N/A | 514.2844 | C26H45NO7S | 515.291676 |
Table 1. Low mass range calibration standards and their exact m/z. The formula shown here is corresponding to the neutral form formula, and m/z is the neutral mass plus or minus a proton.
| CSID | Name | Formula | Monoisotopic Mass | Search Mass | Error (ppm) | R.T. (min) |
| 234 | beta-Alanine | C3H7NO2 | 89.04800 | 89.04805 | 0.62 | 8.08 |
| 1057 | Sarcosine | C3H7NO2 | 89.04768 | 89.04805 | 4.22 | 8.08 |
| 5735 | alanine | C3H7NO2 | 89.04768 | 89.04805 | 4.22 | 8.08 |
| 568 | Creatinine | C4H7N3O | 113.05900 | 113.05889 | 1.00 | 4.41 |
| 128566 | Proline | C5H9NO2 | 115.06333 | 115.06338 | 0.41 | 7.54 |
| 6050 | L-(+)-Valine | C5H11NO2 | 117.07898 | 117.07896 | 0.18 | 7.42 |
| 7762 | Amyl nitrite I | C5H11NO2 | 117.07898 | 117.07896 | 0.18 | 7.42 |
| 135 | 5-amino valeric acid | C5H11NO2 | 117.07900 | 117.07896 | 0.38 | 7.42 |
| 242 | trimethylglycine | C5H11NO2 | 117.07900 | 117.07896 | 0.38 | 7.42 |
| 911 | Niacinamide | C6H6N2O | 122.04800 | 122.04793 | 0.55 | 2.60 |
| 1091 | Taurin | C2H7NO3S | 125.01466 | 125.01469 | 0.20 | 7.61 |
| 1030 | Pyrroline hydroxycarboxylic acid | C5H7NO3 | 129.04259 | 129.04259 | 0.02 | 8.51 |
| 7127 | PCA | C5H7NO3 | 129.04259 | 129.04259 | 0.02 | 8.51 |
| 90657 | N-Acryloylglycine | C5H7NO3 | 129.04259 | 129.04259 | 0.02 | 8.51 |
| 388752 | 5-Oxo-D-prolin | C5H7NO3 | 129.04259 | 129.04259 | 0.02 | 8.51 |
| 389257 | 3-Hydroxy-3,4-dihydro-2H-pyrrole-5-carboxylic acid | C5H7NO3 | 129.04259 | 129.04259 | 0.02 | 8.51 |
| 8031176 | Pyrrolidonecarboxylic acid | C5H7NO3 | 129.04259 | 129.04259 | 0.03 | 8.51 |
| 5605 | Hydroxyproline | C5H9NO3 | 131.05824 | 131.05901 | 5.83 | 8.08 |
| 7068 | N-Acetylalanin | C5H9NO3 | 131.05824 | 131.05901 | 5.83 | 8.08 |
| 79449 | Ac-Ala-OH | C5H9NO3 | 131.05824 | 131.05901 | 5.83 | 8.08 |
| 89122 | Ethylformylglycine | C5H9NO3 | 131.05824 | 131.05901 | 5.83 | 8.08 |
| 167744 | l-Glutamic-gamma-semialdehyde | C5H9NO3 | 131.05824 | 131.05901 | 5.83 | 8.08 |
| 388519 | 5-Amino-2-oxopentanoic acid | C5H9NO3 | 131.05824 | 131.05901 | 5.83 | 8.08 |
| 134 | Aminolevulinic acid | C5H9NO3 | 131.05800 | 131.05901 | 7.70 | 8.08 |
| 9312313 | 3-Hydroxy-L-proline | C5H9NO3 | 131.05800 | 131.05901 | 7.70 | 8.08 |
| 566 | Creatine | C4H9N3O2 | 131.06900 | 131.06905 | 0.36 | 8.08 |
| 5880 | L-(+)-Leucine | C6H13NO2 | 131.09464 | 131.09455 | 0.68 | 6.96 |
| 6067 | L-(+)-Isoleucine | C6H13NO2 | 131.09464 | 131.09455 | 0.68 | 6.96 |
| 19964 | L-Norleucine | C6H13NO2 | 131.09464 | 131.09455 | 0.68 | 6.96 |
| 388796 | beta-Leucine | C6H13NO2 | 131.09464 | 131.09455 | 0.68 | 6.96 |
| 548 | Aminocaproic acid | C6H13NO2 | 131.09500 | 131.09455 | 3.48 | 6.96 |
| 6031 | L-(-)-Asparagine | C4H8N2O3 | 132.05350 | 132.05348 | 0.10 | 8.31 |
| 109 | Ureidopropionic acid | C4H8N2O3 | 132.05299 | 132.05348 | 3.71 | 8.31 |
| 6026 | L-Ornithine | C5H12N2O2 | 132.08987 | 132.08988 | 0.02 | 10.37 |
| 64236 | D-Ornithine | C5H12N2O2 | 132.08987 | 132.08988 | 0.02 | 10.37 |
| 5746 | Glutamine | C5H10N2O3 | 146.06914 | 146.06900 | 0.93 | 8.25 |
| 128633 | D-Glutamine | C5H10N2O3 | 146.06914 | 146.06900 | 0.93 | 8.25 |
| 141172 | Ureidoisobutyric acid | C5H10N2O3 | 146.06914 | 146.06900 | 0.93 | 8.25 |
| 21436 | N-Methyl-<scp>D</scp>-aspartic acid | C5H9NO4 | 147.05316 | 147.05300 | 1.13 | 8.06 |
| 21814 | D-(-)-Glutamic acid | C5H9NO4 | 147.05316 | 147.05300 | 1.13 | 8.06 |
| 30572 | L-(+)-Glutamic acid | C5H9NO4 | 147.05316 | 147.05300 | 1.13 | 8.06 |
| 58744 | N-Acetyl-L-serine | C5H9NO4 | 147.05316 | 147.05300 | 1.13 | 8.06 |
| 5907 | L-(-)-methionine | C5H11NO2S | 149.05106 | 149.05095 | 0.70 | 7.39 |
| 6038 | Histidine | C6H9N3O2 | 155.06947 | 155.06940 | 0.48 | 8.33 |
| 5910 | L-(-)-Phenylalanine | C9H11NO2 | 165.07898 | 165.07887 | 0.63 | 6.60 |
| 1025 | Pyridoxine | C8H11NO3 | 169.07390 | 169.07376 | 0.80 | 3.24 |
| 4463 | Oxidopamine [USAN:INN] | C8H11NO3 | 169.07390 | 169.07376 | 0.80 | 3.24 |
| 102750 | 5-(2-aminoethyl)-Pyrogallol | C8H11NO3 | 169.07390 | 169.07376 | 0.80 | 3.24 |
| 388394 | Norepinephrine | C8H11NO3 | 169.07390 | 169.07376 | 0.80 | 3.24 |
| 6082 | L-(+)-Arginine | C6H14N4O2 | 174.11168 | 174.11144 | 1.39 | 10.77 |
| 64224 | D-Arg | C6H14N4O2 | 174.11168 | 174.11144 | 1.39 | 10.77 |
| 780 | heteroauxin | C10H9NO2 | 175.06300 | 175.06304 | 0.18 | 2.32 |
| 67261 | Indole-3-acetaldehyde, 5-hydroxy- | C10H9NO2 | 175.06332 | 175.06304 | 1.65 | 2.32 |
| 3574185 | INDOLE-2-ACETIC ACID | C10H9NO2 | 175.06332 | 175.06304 | 1.65 | 2.32 |
| 5833 | L-(-)-Tyrosine | C9H11NO3 | 181.07390 | 181.07378 | 0.66 | 7.48 |
| 389285 | 3-Amino-3-(4-hydroxyphenyl)propanoic acid | C9H11NO3 | 181.07390 | 181.07378 | 0.66 | 7.48 |
| 13628311 | L-threo-3-phenylserine | C9H11NO3 | 181.07390 | 181.07378 | 0.66 | 7.48 |
| 425 | 4-hydroxy-4-(3-pyridyl)butanoic acid | C9H11NO3 | 181.07401 | 181.07378 | 1.25 | 7.48 |
| 13899 | 3-(1H-Indol-3-yl)acrylic acid | C11H9NO2 | 187.06332 | 187.06330 | 0.15 | 6.44 |
| 10607876 | Indoleacrylic acid | C11H9NO2 | 187.06332 | 187.06330 | 0.15 | 6.44 |
| 389120 | N6,N6,N6-Trimethyl-L-lysine | C9H20N2O2 | 188.15248 | 188.15221 | 1.45 | 10.87 |
| 388321 | 5"-S-Methyl-5"-thioadenosine | C11H15N5O3S | 297.08957 | 297.08898 | 2.00 | 2.56 |
| 144 | 9-(5-s-methyl-5-thiopentofuranosyl)-9h-purin-6-amine | C11H15N5O3S | 297.09000 | 297.08898 | 3.43 | 2.56 |
| 111188 | Glutathione | C10H17N3O6S | 307.08380 | 307.08345 | 1.14 | 8.02 |
Table 2A.
| CSID | Name | Formula | Monoisotopic Mass | Search Mass | Error (ppm) | R.T. (min) |
| 857 | Methylglyoxal | C3H4O2 | 72.02100 | 72.02108 | 1.03 | 7.70 |
| 1057 | Sarcosine | C3H7NO2 | 89.04768 | 89.04747 | 2.33 | 8.19 |
| 5735 | alanine | C3H7NO2 | 89.04768 | 89.04747 | 2.33 | 8.19 |
| 234 | beta-Alanine | C3H7NO2 | 89.04800 | 89.04747 | 5.93 | 8.19 |
| 55423 | R-lactic acid | C3H6O3 | 90.03169 | 90.03143 | 2.91 | 5.12 |
| 61460 | Hydroxypropionic acid | C3H6O3 | 90.03169 | 90.03143 | 2.91 | 5.12 |
| 96860 | L-(+)-lactic acid | C3H6O3 | 90.03169 | 90.03143 | 2.91 | 5.12 |
| 592 | Lactic acid | C3H6O3 | 90.03200 | 90.03143 | 6.29 | 5.12 |
| 650 | Dihydroxyacetone | C3H6O3 | 90.03200 | 90.03143 | 6.29 | 5.12 |
| 731 | Glyceraldehyde | C3H6O3 | 90.03200 | 90.03143 | 6.29 | 5.12 |
| 1086 | Sulfuric acid | H2O4S | 97.96738 | 97.96683 | 5.63 | 8.13 |
| 128566 | Proline | C5H9NO2 | 115.06333 | 115.06302 | 2.67 | 7.78 |
| 1078 | Succinic acid | C4H6O4 | 118.02661 | 118.02630 | 2.66 | 7.72 |
| 466979 | Erythrono-1,4-lactone | C4H6O4 | 118.02661 | 118.02630 | 2.66 | 7.72 |
| 4483398 | D-Erythronic g-lactone | C4H6O4 | 118.02661 | 118.02630 | 2.66 | 7.72 |
| 473 | Methylmalonic acid | C4H6O4 | 118.02700 | 118.02630 | 5.96 | 7.72 |
| 8527138 | (3S,4R)-3,4-Dihydroxydihydrofuran-2(3H)-one | C4H6O4 | 118.02700 | 118.02630 | 5.96 | 7.72 |
| 140384 | 2-ketocaproic acid | C6H10O3 | 130.06299 | 130.06270 | 2.24 | 2.35 |
| 164251 | Methyloxovaleric acid | C6H10O3 | 130.06299 | 130.06270 | 2.24 | 2.35 |
| 388419 | (3S)-3-Methyl-2-oxopentanoic acid | C6H10O3 | 130.06299 | 130.06270 | 2.24 | 2.35 |
| 15642233 | Ketoleucine | C6H10O3 | 130.06299 | 130.06270 | 2.24 | 2.35 |
| 46 | a-Oxo-b-methylvaleric acid | C6H10O3 | 130.06300 | 130.06270 | 2.36 | 2.35 |
| 69 | Alpha-ketoisocaproic acid | C6H10O3 | 130.06300 | 130.06270 | 2.36 | 2.35 |
| 134 | Aminolevulinic acid | C5H9NO3 | 131.05800 | 131.05795 | 0.36 | 8.19 |
| 9312313 | 3-Hydroxy-L-proline | C5H9NO3 | 131.05800 | 131.05795 | 0.36 | 8.19 |
| 5605 | HYDROXYPROLINE | C5H9NO3 | 131.05824 | 131.05795 | 2.23 | 8.19 |
| 7068 | N-Acetylalanin | C5H9NO3 | 131.05824 | 131.05795 | 2.23 | 8.19 |
| 79449 | Ac-Ala-OH | C5H9NO3 | 131.05824 | 131.05795 | 2.23 | 8.19 |
| 89122 | Ethylformylglycine | C5H9NO3 | 131.05824 | 131.05795 | 2.23 | 8.19 |
| 167744 | l-Glutamic-gamma-semialdehyde | C5H9NO3 | 131.05824 | 131.05795 | 2.23 | 8.19 |
| 388519 | 5-Amino-2-oxopentanoic acid | C5H9NO3 | 131.05824 | 131.05795 | 2.23 | 8.19 |
| 5880 | L-(+)-Leucine | C6H13NO2 | 131.09464 | 131.09419 | 3.39 | 7.09 |
| 6067 | L-(+)-Isoleucine | C6H13NO2 | 131.09464 | 131.09419 | 3.39 | 7.09 |
| 19964 | L-Norleucine | C6H13NO2 | 131.09464 | 131.09419 | 3.39 | 7.09 |
| 388796 | beta-Leucine | C6H13NO2 | 131.09464 | 131.09419 | 3.39 | 7.09 |
| 548 | Aminocaproic acid | C6H13NO2 | 131.09500 | 131.09419 | 6.18 | 7.09 |
| 109 | Ureidopropionic acid | C4H8N2O3 | 132.05299 | 132.05321 | 1.60 | 8.28 |
| 6031 | L-(-)-Asparagine | C4H8N2O3 | 132.05350 | 132.05321 | 2.21 | 8.28 |
| 6026 | L-Ornithine | C5H12N2O2 | 132.08987 | 132.08961 | 1.98 | 10.36 |
| 64236 | D-Ornithine | C5H12N2O2 | 132.08987 | 132.08961 | 1.98 | 10.36 |
| 193317 | L-(−)-Malic acid | C4H6O5 | 134.02153 | 134.02130 | 1.72 | 7.95 |
| 510 | (±)-Malic Acid | C4H6O5 | 134.02200 | 134.02130 | 5.25 | 7.95 |
| 133224 | threonic acid | C4H8O5 | 136.03717 | 136.03688 | 2.14 | 7.70 |
| 388628 | 2,3,4-Trihydroxybutanoic acid | C4H8O5 | 136.03717 | 136.03688 | 2.14 | 7.70 |
| 2061231 | DL-erythronic acid | C4H8O5 | 136.03717 | 136.03688 | 2.14 | 7.70 |
| 21436 | N-Methyl-<scp>D</scp>-aspartic acid | C5H9NO4 | 147.05316 | 147.05299 | 1.16 | 8.05 |
| 21814 | D-(-)-Glutamic acid | C5H9NO4 | 147.05316 | 147.05299 | 1.16 | 8.05 |
| 30572 | L-(+)-Glutamic acid | C5H9NO4 | 147.05316 | 147.05299 | 1.16 | 8.05 |
| 58744 | N-Acetyl-L-serine | C5H9NO4 | 147.05316 | 147.05299 | 1.16 | 8.05 |
| 6038 | Histidine | C6H9N3O2 | 155.06947 | 155.06930 | 1.09 | 8.36 |
| 199 | Allantoin | C4H6N4O3 | 158.04401 | 158.04387 | 0.88 | 4.76 |
| 6082 | L-(+)-Arginine | C6H14N4O2 | 174.11168 | 174.11154 | 0.80 | 10.76 |
| 64224 | D-Arg | C6H14N4O2 | 174.11168 | 174.11154 | 0.80 | 10.76 |
| 58576 | N-Acetyl-L-Aspartic acid | C6H9NO5 | 175.04807 | 175.04803 | 0.18 | 7.87 |
| 996 | Pyrophosphoric Acid | H4O7P2 | 177.94299 | 177.94331 | 1.79 | 8.42 |
| 5589 | Glucose | C6H12O6 | 180.06339 | 180.06346 | 0.41 | 7.53 |
| 17893 | Mannose | C6H12O6 | 180.06339 | 180.06346 | 0.41 | 7.53 |
| 58238 | .beta.-D-Glucopyranose | C6H12O6 | 180.06339 | 180.06346 | 0.41 | 7.53 |
| 71358 | .alpha.-D-Glucopyranose | C6H12O6 | 180.06339 | 180.06346 | 0.41 | 7.53 |
| 134838 | 3-deoxy-arabino-hexonic acid | C6H12O6 | 180.06339 | 180.06346 | 0.41 | 7.53 |
| 388332 | L-Sorbopyranose | C6H12O6 | 180.06339 | 180.06346 | 0.41 | 7.53 |
| 388476 | beta-D-galactopyranose | C6H12O6 | 180.06339 | 180.06346 | 0.41 | 7.53 |
| 388480 | .alpha.-D-Galactopyranose | C6H12O6 | 180.06339 | 180.06346 | 0.41 | 7.53 |
| 388775 | beta-D-Fructofuranose | C6H12O6 | 180.06339 | 180.06346 | 0.41 | 7.53 |
| 10239179 | Inositol | C6H12O6 | 180.06339 | 180.06346 | 0.41 | 7.53 |
| 16736992 | Cis-inositol | C6H12O6 | 180.06339 | 180.06346 | 0.41 | 7.53 |
| 17216070 | allose | C6H12O6 | 180.06339 | 180.06346 | 0.41 | 7.53 |
| 17216093 | L-Sorbose | C6H12O6 | 180.06339 | 180.06346 | 0.41 | 7.53 |
| 201 | hexopyranose | C6H12O6 | 180.06300 | 180.06346 | 2.53 | 7.53 |
| 868 | 1,2,3,4,5,6-cyclohexanhexol | C6H12O6 | 180.06300 | 180.06346 | 2.53 | 7.53 |
| 2068 | Theophylline | C7H8N4O2 | 180.06473 | 180.06346 | 7.04 | 7.53 |
| 4525 | 1,7-dimethyl-Xanthine | C7H8N4O2 | 180.06473 | 180.06346 | 7.04 | 7.53 |
| 5236 | Theobromine | C7H8N4O2 | 180.06473 | 180.06346 | 7.04 | 7.53 |
| 1161 | isocitric acid | C6H8O7 | 192.02701 | 192.02704 | 0.15 | 8.18 |
| 305 | Citric acid | C6H8O7 | 192.02699 | 192.02704 | 0.23 | 8.18 |
| 963 | pantothenic acid | C9H17NO5 | 219.11067 | 219.11049 | 0.84 | 6.72 |
| 6361 | D-pantothenic acid | C9H17NO5 | 219.11067 | 219.11049 | 0.84 | 6.72 |
| 960 | palmitic acid | C16H32O2 | 256.23999 | 256.24000 | 0.05 | 1.73 |
| 111188 | Glutathione | C10H17N3O6S | 307.08380 | 307.08339 | 1.35 | 8.03 |
| 388337 | N-Acetylneuraminic acid | C11H19NO9 | 309.10599 | 309.10585 | 0.45 | 7.43 |
| 392681 | N-Acetyl-alpha-neuraminic acid | C11H19NO9 | 309.10599 | 309.10585 | 0.45 | 7.43 |
| 392810 | Sialic acid Neu5Ac | C11H19NO9 | 309.10599 | 309.10585 | 0.45 | 7.43 |
Table 2B.
Table 2. List of untargeted metabolites detected in HCT 8 cells (2.78 x 10⁵ cells equivalence). Table 2A and 2B include components extraction information: retention time, m/z and mass error, and meanwhile, database search results: Chemspider ID (CSID), name, formula, and so on. Here the samples analyzed are equal to metabolites extracted from 2.78 x 10⁵ cells, and the intensity threshold is 1 x 10⁷ to avoid tedious result for demonstration aim.
