光度法蛋白的测定
English
Share
Overview
测量浓度是许多生化检测方法的基本步骤。光度法蛋白质测定利用这一事实,越样品含有吸光物质,少光将传送通过它。由于浓度与吸收之间的关系是线性的这种现象可以用于测量样品中的浓度在哪里是未知。
这个视频的光度蛋白测定基础知识,介绍了布拉德福德测定和洛瑞法。视频中的过程将涵盖典型的布拉德福德测定。应用程序覆盖包括直接测量很小卷的核酸浓度和纯度进行了表征,耦合效率的一种仿生材料和另一种变异的光度蛋白测定使用雷染料的测定。
样品中的蛋白质浓度测定的是在许多不同的生化分析的基本步骤。光度法测定可以用样本量太小。越多样本含有吸光物质,少光将传送通过它。这提供了吸收物质的定量测定。这些概念是如此根本的科学的文章,介绍的两种技术是在三个最常被引用文件中的所有时间。本视频将显示背后一些最常见的光度蛋白质的概念,测定技术、 执行的方式和如何对收集的数据进行分析。
光度法蛋白测定基于浓度与光吸收能力之间的关系。这就是所谓的啤酒 — 朗伯定律,其中指出,吸光物质的浓度是成正比的吸光度。
这一原则是所有光度蛋白质测定方法的基础。
为直接吸收分析测量不变的蛋白样品的吸光度值。由于其芳香侧链,色氨酸和酪氨酸残基给高吸光度读数在波长为 280 nm。
然而,这些氨基酸 — — 这是两个最不经常发现在蛋白质–都存在于不同数量在每个蛋白,所以每个测定是独特。为了克服这一局限性,更复杂的检测方法-那些不依赖于这些氨基酸-被开发了。
一个例子是布拉德福德测定,彩色的染料对样品的添加位置。染料,考马斯亮蓝,被称为响应按比例更多蛋白质目前,更多的绑定事件与染料。
然后,测定吸光度的绑定的考马斯亮蓝染料,吸收的光,594 测定蛋白质浓度毫微米。然而,布拉德福德测定是线性作短距离的浓度,因此稀释常被要求在分析之前。
洛瑞法结合双缩脲试剂、 反应与肽键的铜离子和福林 Ciocâlteu 试剂,氧化芳香蛋白质残留的碱性溶液。由此产生的颜色变化是样品的蛋白质浓度成正比。
吸收的减少福林试剂可以确定在 750 毫微米。像直接吸收,每种蛋白质有着独特的反应,和必须为感兴趣的蛋白质进行校准。既然我们已经回顾了一些最常见的化验背后的基本原则,让我们看看如何直接进行吸收和布拉德福德测定。
若要开始直接吸收分析,分光光度计被校准与一片空白,零测定吸光度。标准的解决方案被编写用于创建校准曲线。分装的第一个标准是添加到试管中,然后放入分光光度计。
吸光度值在 280 nm 然后记录。为每个标准,每次运行使用清洁试管重复此过程。一旦完成,校准曲线被创建通过绘制浓度与吸光度。这条线的斜率是摩尔的衰减系数,它涉及到浓度的吸光度。
接下来,未知的样品添加到试管,并录得的吸光度值。随着不同的光度法测定方法的数据分析是相似的我们将介绍,之后我们看看布拉德福德测定。
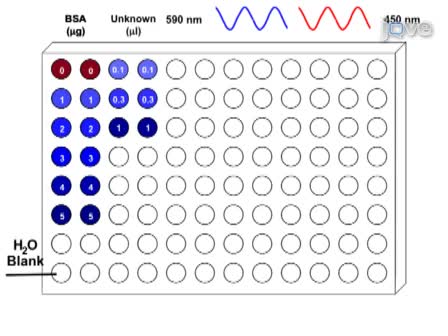
在这里,与牛血清白蛋白标准 96 孔板上进行布拉德福德蛋白测定。若要开始,BSA 股票解决方案做好准备。
未知的解决方案被稀释用去离子水,以确保浓度检测的范围之内。根据试剂,考马斯亮染料可能还需要稀释。然后,校准曲线是由 96 孔板中加入牛血清白蛋白标准设置的。
加去离子的水达到所需的浓度来生成标准曲线。未知的样品应添加到一式三份,确保采取准确的测量板。考马斯亮染料下一步添加到每个井,用吸管搅拌。
去离子的水被添加到空井作为一片空白,测量吸光度。等待 5 分钟染料要绑定后, 吸光度测量板阅读器在 590 毫微米。
现在,我们已经进行了几个检测方法,让我们看看如何来分析数据。每个光度蛋白质测定方法基于啤酒 — 朗伯定律。
标准测量吸光度用于创建校准曲线,然后用来确定未知样品的浓度。这条曲线可以手动绘制,虽然新的分光光度法工具将创建校准曲线,一旦测量了所有的标准。这些系统还将计算蛋白质浓度未知的样品进行分析。
既然我们已经讨论了如何分析光度法蛋白质测定数据,让我们看看一些利用这些程序的方法。
光度法蛋白质测定的原则也可以用于直接测量核酸浓度。Nanodrop 分光光度计接受样品的光学活性的基座上体积很小。然后测定吸光度,和系统自动确定核酸浓度。因为蛋白质和其他来源可以干扰测量,样品纯度分析确定了 280 到 260 nm 和 260 到 230 nm 吸光度比值。纯核酸通常产生大约 1.8 和大约 2.0 的比率为 DNA 和 RNA,分别。
光度法蛋白质测定也可以用于生产的仿生材料的灵感来自于自然,征求特定细胞的反应。重组的表面被绑定到聚苯乙烯珠子来模拟细菌吸附到宿主细胞。布拉德福德测定用于确定珠在仿生材料的生产重组粘附的耦合效率。
替代的光度蛋白质检测可以用于检测和表征蛋白抗菌药物。雷亮蓝 R 染料是以共价键键合到热杀死细菌。抗菌蛋白是染色溶液中孵化的。然后,离心分离样品,和吸光的上清液在 595 nm 衡量使用酶标仪。增加的吸光度,释放到标记的细菌,培养上清的可溶性染料是酶活性的定量测定。
你刚看了光度蛋白质测定的朱庇特的视频。这个视频描述光度法测定的基本原则,走过去一些常见的检测方法,一般的程序,覆盖技术的一些新进展。谢谢观赏 !
Procedure
Disclosures
Transcript
Determining the concentration of a protein in samples is a fundamental step in many biochemical assays. Photometric determination can be done with small sample sizes. The more a sample contains light-absorbing substances, the less the light will transmit through it. This provides a quantitative measurement of the absorbing substances. These concepts are so fundamental to science that the articles that introduced two of the techniques are in the three most cited papers of all time. This video will show the concepts behind some of the most common photometric protein determination techniques, how they are performed, and how the gathered data is analyzed.
Photometric protein determination is based on the relationship between concentration and light absorbency. This is known as the Beer-Lambert Law, which states that the concentration of a light-absorbing species is proportional to its absorbance.
This principle underlies all photometric protein determination methods.
For direct absorption analysis, the absorbance values of unaltered protein samples are measured. Because of their aromatic side chains, tryptophan and tyrosine residues give the highest absorbance readings at a wavelength of 280 nm.
However, these amino acids-which are two of the least frequently found in proteins-are present in different amounts in every protein, so each determination is unique. To overcome this limitation, more complex assays-that are not dependent on these amino acids-were developed.
One example is the Bradford Assay, where colored dye is added to the sample. The dye, known as Coomassie Blue, responds proportionally-the more protein present, the more binding events with the dye.
Then, protein concentration is determined by measuring the absorbance of the bound Coomassie Blue dye, which absorbs light at 594 nm. However, the Bradford assay is linear over a short range of concentrations, so dilutions are often required before analysis.
The Lowry Method combines the Biuret reagent, an alkaline solution of copper ions that react with peptide bonds, and the Folin-Ciocâlteu reagent, which oxidizes aromatic protein residues. The resulting color change of the sample is proportional to the protein concentration.
The absorbance of the reduced Folin reagent can be determined at 750 nm. Like direct absorption, each protein has a unique response, and must be calibrated for the protein of interest. Now that we’ve reviewed the basic principles behind some of the most common assays, let’s look at how direct absorption and the Bradford assay are performed.
To begin a direct absorption analysis, the spectrophotometer is calibrated with a blank to determine zero absorbance. Standard solutions are prepared for use in creating the calibration curve. Then, an aliquot of the first standard is added to a cuvette, and placed into the spectrophotometer.
The absorbance value at 280 nm is then recorded. This process is repeated for each standard, using a clean cuvette for each run. Once complete, a calibration curve is created by plotting the absorbance versus concentration. The slope of this line is the molar attenuation coefficient, which relates absorbance to concentration.
Next, the unknown sample is added to a cuvette, and the absorbance value is recorded. As the data analysis for the different photometric determination methods is similar, we will cover that after we look at the Bradford assay.
Here, the Bradford protein assay is performed with a BSA standard on a 96-well plate. To begin, BSA stock solutions are prepared.
The unknown solutions are diluted with deionized water to ensure that the concentrations are within the assay’s range. Depending on the kit, the Coomassie dye may also require dilution. Then, the calibration curve is set up by adding the BSA standards to the 96-well plate.
Deionized water is added to reach the needed concentration to generate a standard curve. The unknown sample should be added to the plate in triplicates to ensure an accurate measurement is taken. Coomassie dye is next added to each well, mixing with the pipette.
Deionized water is added to an empty well as a blank, to measure the absorbance. After waiting 5 min for the dye to bind, the absorbance is measured in a plate-reader at 590 nm.
Now that we’ve performed a few assays, let’s look at how to analyze the data. Each photometric protein determination method is based on the Beer-Lambert Law.
The measured absorbance of the standards is used to create a calibration curve, which is then used to determine the concentration of unknown samples. This curve can be manually plotted, though newer spectrophotometric tools will create the calibration curve once all standards have been measured. These systems will also calculate protein concentration as unknown samples are analyzed.
Now that we’ve reviewed how to analyze photometric protein determination data, let’s look at some of the ways these procedures are utilized.
The principles of photometric protein determination can also be used to directly measure nucleic acid concentration. The nanodrop spectrophotometer accepts samples of very small volume onto an optically active pedestal. The absorbance is then measured, and the system automatically determines the nucleic acid concentration. Because proteins and other sources can interfere with measurements, sample purity is determined by analyzing the 260 to 280 nm and 260 to 230 nm absorbance ratios. Pure nucleic acids typically yield ratios of approximately 1.8 and approximately 2.0 for DNA and RNA, respectively.
Photometric protein determination can also be used in the production of biomimetic materials, which are inspired from nature to elicit specific cellular responses. Recombinant adhesins are bound to polystyrene beads to simulate bacterial attachment to host cells. The Bradford assay is used to determine the coupling efficiency of the recombinant adhesion to the beads in the production of the biomimetic material.
Alternative photometric protein assays can be used in the detection and characterization of protein antimicrobials. Remazol brilliant blue R dye is covalently bonded to heat-killed bacteria. The protein antimicrobial is incubated in the dyed solution. Then, the sample is centrifuged, and the absorbance of the supernatant at 595 nm is measured using a microplate spectrophotometer. Increased absorbance, by the soluble dye released into the supernatant from the labeled bacteria, is a quantitative measurement of enzymatic activity.
You’ve just watched JoVE’s video on photometric protein determination. This video described the underlying principles of photometric determination, went over general procedures for some common assays, and covered some new advances in techniques. Thanks for watching!