タンパク質の吸光光度定量
English
Share
Overview
濃度の測定は、多くの生化学的な試金の基本的なステップです。タンパク質の吸光光度定量活用という事実をサンプルに光吸収物質が含まれていますより多く、少ない光は、それを送信します。濃度と吸収との関係は線形なのでこの現象使用できます試料中濃度を測定する不明です。
このビデオでは、タンパク質の吸光光度定量法の基本を解説し、ブラッドフォードの試金および Lowry 方法を紹介します。ビデオの手順は一般的なブラッドフォードの試金をカバーします。覆われているアプリケーションには、核酸濃度・純度を特徴付けるための量が非常に少ない、バイオミメティック材料の効率と Remazol 色素を用いたタンパク質の吸光光度定量の別のバリエーションを結合の決定の直接測定が含まれます。
多くの生化学的な試金の基本的なステップは、サンプル中のタンパク質の濃度を決定します。小さなサンプル サイズの吸光光度定量を行うことができます。サンプルに光吸収物質が含まれていますより多く、それを介して光を送信少ない。これは吸収物質の量的な測定を提供します。これらの概念は、2 つのテクニックを紹介する記事は、すべての時間の 3 つの最も引用されたペーパー科学にとても基本的です。定量方法、実行方法、および収集したデータの分析方法、このビデオは最も一般的な吸光光度タンパク質のいくつかの背後にある概念が表示されます。
フォト メトリックのタンパク質の定量は、濃度と光の吸収との関係に基づきます。これは光吸収の種の集中はその吸光度に比例してビール-ランベルトの法則として知られています。
この原則は、すべてのタンパク質の吸光光度定量法を基づいています。
直接吸光分析、不変の蛋白質のサンプルの吸光度値が計測されます。トリプトファンとチロシン残基、芳香族の側鎖のため波長 280 で最高の吸光度の測定値に与える nm。
ただし、これらのアミノ酸を 2 つの最も頻繁に見られるタンパク質は各決定がユニークなのですべての蛋白質のさまざまな量で存在します。この制限より複雑なアッセイを克服するために-これらのアミノ酸に依存していない-を開発しました。
1 つの例はサンプルに着色された染料を追加する位置のブラッドフォードの試金です。という Coomassie 青い染料は、それに比例してより多くのタンパク質、染付詳細バインド イベントを応答します。
594 で光を吸収するバインドされた Coomassie 青い色素の吸光度を測定することによって蛋白質の集中の決定、nm。しかし、ブラッドフォードの試金は集中の短い範囲に線形希釈はしばしば解析の前に必要なのでです。
Lowry 法は、ビウレットの試薬、ペプチド結合と反応して銅イオンと芳香族アミノ酸の酸化 Ciocâlteu Folin 試薬のアルカリ溶液を組み合わせたものです。サンプルの結果の色の変化はタンパク質濃度に比例します。
750 に減らされた Folin 試薬の吸光度を判断できる nm。直接吸収のような各蛋白質はユニークな応答には、興味の蛋白質のためにキャリブレーションする必要があります。今、我々 は、最も一般的なアッセイの背後にある基本的な原則を確認したところ、吸収とブラッドフォードの試金の実行方法直接見てみましょう。
直接吸光分析するには、ゼロの吸光度を決定する空白を分光光度計を校正します。標準的なソリューションは、検量線の作成に使用、調理されます。その後、最初の標準の因数は、キュベットに追加、分光光度計に配置。
吸光度値 280 nm が記録されます。このプロセスは、実行ごとにきれいなキュベットを使用して、それぞれの標準の繰り返されます。完了すると、検量線は濃度と吸光度をプロットすることによって作成されます。この直線の傾きは、濃度を吸光度を関連するモル減衰係数です。
次に、未知のサンプルは、キュベットに追加され、吸光度値が記録されます。同様に別の吸光光度定量法のデータ解析と同様、ブラッドフォードの試金を見ているカバーします。
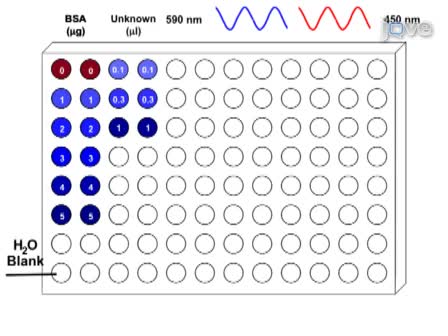
ここでは、ブラッドフォード蛋白質の試金は 96 ウェル プレートに BSA の標準で実行されます。まず、BSA 在庫ソリューションを用意しています。
未知のソリューションは、濃度の試金の範囲内で確実に脱イオン水で希釈しました。キットによって Coomassie の染料はまた希釈を必要があります。その後、検量線は 96 ウェル プレートに BSA の基準を追加することによって設定されます。
脱イオン水は、標準曲線の生成に必要な濃度に達するに追加されます。未知のサンプルは、トリプリケート正確な測定を使用するために、プレートを追加必要があります。Coomassie 色素が追加されます次に、ピペットを混ぜて、各ウェルに。
脱イオン水は、空白、吸光度を測定すると、空のウェルに追加されます。590 でプレート リーダーにバインドする染料のための 5 分を待機した後、吸光度を測定 nm。
今では、いくつかのアッセイを実行した、データを分析する方法を見てみましょう。各フォト メトリック タンパク質定量法は、ビール ランベルトの法則に基づいています。
基準の測定した吸光度を使用を使用して、未知試料の濃度を決定する検量線を作成します。この曲線は、プロットされます手動で、すべての標準を測定した後、新しい吸光光度ツールは較正曲線を作成する作業も。未知サンプルを分析、これらのシステムはまた蛋白質の集中を計算します。
今ではタンパク質の吸光光度定量データを分析する方法を確認しましたところ、いくつかのこれらの手順は、利用方法を見てみましょう。
核酸濃度を直接測定するため、タンパク質の吸光光度定量の原理を使用もできます。Nanodrop 分光光度計は、光学活性な台座の上に非常に少量の試料を受け入れます。吸光度を測定し、システムは自動的に核酸の濃度を決定します。サンプルの純度が 280 に 260 の分析によって決定されます測定蛋白質と他の情報源を妨害することができます、ため nm と 230 に 260 nm の吸光度比。純粋な核酸通常降伏比約 1.8 と 2.0 約 DNA および RNA のそれぞれ。
フォト メトリックのタンパク質の定量は、細胞の特定の応答を引き出すために自然からインスピレーションを得た、バイオミメティック材料の生産にも使用できます。組換えアドヘシンは宿主細胞に細菌の付着をシミュレートするポリスチレンのビードにバインドされます。ブラッドフォードの試金は、バイオミメティック材料の生産にビーズに組換えの接着結合効率を決定するためです。
代替測光蛋白質の試金は、検出と抗菌剤タンパク質の解析で使用できます。鮮やかなブルーの Remazol R 染料は熱殺された細菌を帯び。抗菌蛋白質は染めのソリューションで孵化します。その後、サンプルを遠心分離すると、595 で上清の吸光度とマイクロ プレート分光光度計を用いて nm。増加吸光度、培養上清をラベル付きの細菌からリリースされた水溶性色素、酵素活性の定量測定。
タンパク質の吸光光度定量にゼウスのビデオを見てきただけ。このビデオ吸光光度定量の基本原則を説明したいくつかの一般的な試金のための一般的な手順を行って、技術のいくつかの新しい進歩をカバーします。見てくれてありがとう!
Procedure
Disclosures
Transcript
Determining the concentration of a protein in samples is a fundamental step in many biochemical assays. Photometric determination can be done with small sample sizes. The more a sample contains light-absorbing substances, the less the light will transmit through it. This provides a quantitative measurement of the absorbing substances. These concepts are so fundamental to science that the articles that introduced two of the techniques are in the three most cited papers of all time. This video will show the concepts behind some of the most common photometric protein determination techniques, how they are performed, and how the gathered data is analyzed.
Photometric protein determination is based on the relationship between concentration and light absorbency. This is known as the Beer-Lambert Law, which states that the concentration of a light-absorbing species is proportional to its absorbance.
This principle underlies all photometric protein determination methods.
For direct absorption analysis, the absorbance values of unaltered protein samples are measured. Because of their aromatic side chains, tryptophan and tyrosine residues give the highest absorbance readings at a wavelength of 280 nm.
However, these amino acids-which are two of the least frequently found in proteins-are present in different amounts in every protein, so each determination is unique. To overcome this limitation, more complex assays-that are not dependent on these amino acids-were developed.
One example is the Bradford Assay, where colored dye is added to the sample. The dye, known as Coomassie Blue, responds proportionally-the more protein present, the more binding events with the dye.
Then, protein concentration is determined by measuring the absorbance of the bound Coomassie Blue dye, which absorbs light at 594 nm. However, the Bradford assay is linear over a short range of concentrations, so dilutions are often required before analysis.
The Lowry Method combines the Biuret reagent, an alkaline solution of copper ions that react with peptide bonds, and the Folin-Ciocâlteu reagent, which oxidizes aromatic protein residues. The resulting color change of the sample is proportional to the protein concentration.
The absorbance of the reduced Folin reagent can be determined at 750 nm. Like direct absorption, each protein has a unique response, and must be calibrated for the protein of interest. Now that we’ve reviewed the basic principles behind some of the most common assays, let’s look at how direct absorption and the Bradford assay are performed.
To begin a direct absorption analysis, the spectrophotometer is calibrated with a blank to determine zero absorbance. Standard solutions are prepared for use in creating the calibration curve. Then, an aliquot of the first standard is added to a cuvette, and placed into the spectrophotometer.
The absorbance value at 280 nm is then recorded. This process is repeated for each standard, using a clean cuvette for each run. Once complete, a calibration curve is created by plotting the absorbance versus concentration. The slope of this line is the molar attenuation coefficient, which relates absorbance to concentration.
Next, the unknown sample is added to a cuvette, and the absorbance value is recorded. As the data analysis for the different photometric determination methods is similar, we will cover that after we look at the Bradford assay.
Here, the Bradford protein assay is performed with a BSA standard on a 96-well plate. To begin, BSA stock solutions are prepared.
The unknown solutions are diluted with deionized water to ensure that the concentrations are within the assay’s range. Depending on the kit, the Coomassie dye may also require dilution. Then, the calibration curve is set up by adding the BSA standards to the 96-well plate.
Deionized water is added to reach the needed concentration to generate a standard curve. The unknown sample should be added to the plate in triplicates to ensure an accurate measurement is taken. Coomassie dye is next added to each well, mixing with the pipette.
Deionized water is added to an empty well as a blank, to measure the absorbance. After waiting 5 min for the dye to bind, the absorbance is measured in a plate-reader at 590 nm.
Now that we’ve performed a few assays, let’s look at how to analyze the data. Each photometric protein determination method is based on the Beer-Lambert Law.
The measured absorbance of the standards is used to create a calibration curve, which is then used to determine the concentration of unknown samples. This curve can be manually plotted, though newer spectrophotometric tools will create the calibration curve once all standards have been measured. These systems will also calculate protein concentration as unknown samples are analyzed.
Now that we’ve reviewed how to analyze photometric protein determination data, let’s look at some of the ways these procedures are utilized.
The principles of photometric protein determination can also be used to directly measure nucleic acid concentration. The nanodrop spectrophotometer accepts samples of very small volume onto an optically active pedestal. The absorbance is then measured, and the system automatically determines the nucleic acid concentration. Because proteins and other sources can interfere with measurements, sample purity is determined by analyzing the 260 to 280 nm and 260 to 230 nm absorbance ratios. Pure nucleic acids typically yield ratios of approximately 1.8 and approximately 2.0 for DNA and RNA, respectively.
Photometric protein determination can also be used in the production of biomimetic materials, which are inspired from nature to elicit specific cellular responses. Recombinant adhesins are bound to polystyrene beads to simulate bacterial attachment to host cells. The Bradford assay is used to determine the coupling efficiency of the recombinant adhesion to the beads in the production of the biomimetic material.
Alternative photometric protein assays can be used in the detection and characterization of protein antimicrobials. Remazol brilliant blue R dye is covalently bonded to heat-killed bacteria. The protein antimicrobial is incubated in the dyed solution. Then, the sample is centrifuged, and the absorbance of the supernatant at 595 nm is measured using a microplate spectrophotometer. Increased absorbance, by the soluble dye released into the supernatant from the labeled bacteria, is a quantitative measurement of enzymatic activity.
You’ve just watched JoVE’s video on photometric protein determination. This video described the underlying principles of photometric determination, went over general procedures for some common assays, and covered some new advances in techniques. Thanks for watching!