

Summary
A highly parallel method for measuring the site-specific cleavage of DNA at the single molecule level is described. This protocol demonstrates the technique using the restriction endonuclease NdeI. The method can easily be modified to study any process that results in site-specific DNA cleavage.
Abstract
Site-specific DNA cleavage (SSDC) is a key step in many cellular processes, and it is crucial to gene editing. This work describes a kinetic assay capable of measuring SSDC in many single DNA molecules simultaneously. Bead-tethered substrate DNAs, each containing a single copy of the target sequence, are prepared in a microfluidic flow channel. An external magnet applies a weak force to the paramagnetic beads. The integrity of up to 1,000 individual DNAs can be monitored by visualizing the microbeads under darkfield imaging using a wide-field, low magnification objective. Injecting of a restriction endonuclease, NdeI, initiates the cleavage reaction. Video microscopy is used to record the exact moment of each DNA cleavage by observing the frame in which the associated bead moves up and out of the focal plane of the objective. Frame-by-frame bead counting quantifies the reaction, and an exponential fit determines the reaction rate. This method allows collection of quantitative and statistically significant data on single molecule SSDC reactions in a single experiment.
Introduction
Site-specific DNA cleavage (SSDC) is a key step in many genomic transactions. For example, bacterial restriction-modification (RM)1 and CRISPR2 systems protect cells from attack by phages and plasmids by recognizing and cleaving foreign DNA at specific sequences. In type II RM, restriction endonucleases (REs) recognize short 4–8 base pair (bp) sequences via protein-nucleic acid interactions3. CRISPR-associated endonucleases, such as Cas9, bind to sites via hybridization of the target site with crRNAs bound to the endonucleases4. The creation of site-specific double stranded breaks (DSBs) are also the first step in many DNA recombination events5. For example, the diversity of antigen binding regions created by V(D)J recombination requires the recognition and cleavage of specific target sites6. Some transposons are known to target specific DNA sequences, as well7. Not surprisingly, many site-specific nucleases involved in these processes, such as Cas9, are a key component of gene editing technologies8. In addition, novel site-specific endonucleases (i.e., zinc finger nucleases9 and TALENS10) have also been engineered to edit genomes.
Many methods have been employed to measure the kinetics of site-specific cleavage of nucleic acids. These include gel analysis, fluorescence11,12, and sequencing based methods13. A major advancement was achieved with the tethering of microbeads, which allows DSBs in single molecules of DNA to be detected by the motion of a bead after strand separation. In these methods, different types of forces are employed to ensure strand separation and motion of the bead post-cleavage. In one case, optical traps have been used to measure cleavage of DNA by EcoRV14. In these experiments, target search is the objective of the investigation, with conditions optimized so that site-specific binding is the rate limiting step. One drawback of optical traps is that only a single DNA can be observed at a time. In addition, a periodic large pulling force has to be applied to test for the strand separation.
Another technique uses a combination of flow and weak magnetic forces to pull on the bead in a continuous manner15. In this way, diffusion limited cleavage by NdeI is measured. The method employed allows for the simultaneous measurement of several hundred DNAs at once, allowing for statistical significance to be attained in a single experiment. Experiments based on magnetic tweezers have also been used. In one such study, a retroviral integrase was studied by including a DSB in the insertion oligonucleotide16. Successful integration resulted in the incorporation of DSB in the tethered DNA and loss of the attached bead. In a similar study of the ATP-dependent type III restriction endonuclease EcoPI, tens of DNAs were observed in a single experiment17. Magnetic tweezers hold the advantage that tension, as well as DNA looping, can be controlled and monitored during the reaction.
Presented here is a highly parallel single molecule method for measuring SSDC kinetics, which takes advantage of recent improvements in large-scale tethering of DNAs. This method is an improvement and extension of previous methods used to measure DNA replication18, contour length of DNA19, and cleavage by REs15. In this technique, linear DNAs containing a single copy of the recognition sequence are prepared with biotin at one end and digoxigenin at the other. The biotin binds streptavidin, which is covalently attached to a paramagnetic microbead. The DNA-bead complexes are injected into a microfluidic channel that has been functionalized with anti-digoxigenin FAB fragments. The DNA then tethers to the surface attachment points via binding of the digoxigenin to the adsorbed FAB fragments. Weak magnetic forces applied with a permanent magnet keep the bead from sticking non-specifically to the surface. Samples can be injected rapidly (<30 s) into the flow channel to activate the cleavage reaction. Flow is turned off during data collection. As each DNA is cleaved, the exact time of cleavage can be determined by recording the frame in which the bead moves up and out of the focal plan of the objective, thus disappearing from the video record. A frame-by-frame count of remaining beads can be used to quantify the reaction progress.
Presented below is the complete protocol as well as example data collected using NdeI. As an example of how the technique can be applied, cleavage rates for a range of protein concentrations are measured at two different concentrations of magnesium, an essential metal cofactor. Although this application of the protocol uses NdeI, the method can be adapted for use with any site-specific nuclease by varying the DNA substrate design.
Subscription Required. Please recommend JoVE to your librarian.
Protocol
1. Making the flow cell
- Washing the coverslips
- Place coverslips in staining jars and sonicate with ethanol (EtOH), then with 1 M KOH (for 30 min each). To avoid KOH precipitation in EtOH, rinse thoroughly with ddH2O between washes.
- Repeat both EtOH and the KOH washing steps 1x for a total number of four washes (two EtOH and two KOH). Store cleaned coverslips in ddH2O in staining jars.
- Cut loading and exit tubes (8 cm long) using a clean razor and insert into holes in a clean glass slide. Use PE-20 for inlet and PE-60 for outlet. Epoxy for 5 min to secure tubing and trim off any excess tubing.
NOTE: Glass slides measure 2'' x 3'' x 1 mm. Holes are drilled in pairs 15 mm apart. Each pair forms either end of a single channel. The tubing with the smaller ID is used for the inlet, as this reduces the upstream dead volume and thus the mixing time required (Figure 1). - Line up and apply precut double-sided tape with channel pattern cut out over holes on the glass slide. Smooth out with plastic forceps to achieve a good seal.
NOTE: The double-sided tape used in this experiment is 120 µm thick, and the channels are 2 mm wide and 15 mm long. Channels are cut using a knife printer (Table of Materials). It is possible to fit up to four channels on a single coverslip. See Figure 1 for an image of the flow cell. - After peeling off the backing, apply a clean coverslip (dried with compressed air) over the tape and smooth out again with plastic forceps for a good seal.
- Epoxy the edge off the coverslip to seal the flow cell and let it cure.
2. Preparation of labeled DNA for tethering
- In a PCR tube, prepare 50 µL of PCR reaction mix containing 0.02 U/µL high fidelity DNA polymerase, 200 µM dNTPs, 0.5 µM forward primer, 0.5 µM reverse primer, and 250 ng of M13mp18 vector DNA.
NOTE: Here, the forward primer (biotin-CCAACTTAATCGCCTTGC) and reverse primer (digoxigenin-TGACCATTAGATACATTTCGC) were chosen to amplify a region approximately 1,000 bp long, spanning from positions 6338 to 107 in the circular genome of the M13mp18 DNA. There is a single NdeI site in the middle of the amplified region. The forward primer is 5ʹ labeled with digoxigenin, which binds the anti-digoxigenin on the coverslip. The reverse primer is 5ʹ labeled with biotin, which binds the streptavidin-coated beads. - Insert the PCR tube in thermocycler and follow the cycle as shown in Table 1.
- Purify the PCR product with a PCR clean-up kit following the manufacturer's protocol.
NOTE: Using the kit specified in the Table of Materials, the typical DNA yield is ~2 µg.
3. Tethering of DNA and beads
- Prepare 10 mL of buffer A (1 M Tris-HCl [pH = 7.5], 50 mM NaCl, 2 mM MgCl2, 1 mg/mL β-Casein, 1 mg/mL Pluronic F-127). Degas in a vacuum desiccator for at least 1 h.
- To functionalize flow cell, inject 25 µL of anti-digoxigenin FAB fragments (20 µg/mL) in PBS into the flow channel. Use gel loading tips to fit into the PE-60 tubing. Incubate at room temperature (RT) for 30 min.
- After incubation, flush the channel by pulling 0.5 mL of buffer A through the channel using a syringe. Take care not to introduce air into the channel.
- After functionalization, mount the flow cell on an inverted microscope. Hook up the outlet tube to a syringe pump and put the inlet tube into a microcentrifuge tube containing buffer A.
- Manually pull at least 0.5 mL of buffer A to flush the system and prime the pump. Let the pump run at 10 µL/min for at least 5 min to equilibrate the system.
- To prepare the beads (Table of Materials), vortex the stock bottle of beads and pipette 1.6 µL of the 10 mg/mL stock beads into 50 µL of buffer A, then vortex.
- Using a magnetic separator, pipette out the buffer and resuspend in 50 µL of buffer A, then vortex.
- Repeat step 3.7 2x for a total of three washes. For the last wash, resuspend in 100 µL of buffer A and vortex to achieve a final concentration of 160 µg/mL.
- To complex the DNA and beads, first prepare 480 µL of 0.5 pM labeled DNA substrate in buffer A. Then, pipette in 20 µL of 160 µg/mL bead suspension, making sure to vortex the beads before pipetting. Place on a rotator for 3 min.
- After 3 min, immediately load into channel at a flow rate of 10 µL/min for ~15 min or until sufficient bead tethering is observed.
NOTE: Beads should not be so densely packed that they interact with each other on the surface (see discussion section). - To wash the channel of all free beads, switch the inlet tube to a fresh tube of buffer A and flow in at 50 µL/min for at least 10 min or until no loose beads are observed.
4. Data collection and analysis
- To prepare for data collection, place inlet tube into a microcentrifuge tube containing at least 100 µL of NdeI (0.25–4.00 U/mL) in buffer A. Lower the permanent magnet over the flow channel, and position the light source off axis for darkfield imaging.
NOTE: Two annular rare earth magnets, epoxied together, are held 8 mm above the active surface of the flow channel using a cantilevered optical post during data collection. A goose neck lamp is used for the off-axis light course. - Use a commercial microscope, video camera, and data collection software (Table of Materials). In the software, click the "Exposure" tab, and set "Exposure Time" to 10 ms. Click "Timelapse" tab and set "Image Count" to 600, "Duration" to 20 min, and "Interval" to 2 s. Click "Run" to start data collection.
- On a syringe pump, set the flow rate to 150 µL/min and injection volume to 80 µL. Press "Run" at 1 min into data collection. After injection, turn off the pump and close the valve to prevent flow during data collection.
- Once data is collected, open image analysis software (Table of Materials). Under the "File" tab, choose "Import" | "Image Sequence". Locate the image files in the pop-up menu and click "Open".
- Set the threshold by choosing "Adjust Theshold" under the "Image" pull-down menu. Use the slider bar to set the threshold value to identify bright spots corresponding to beads in the image.
- Count the bright spots in each frame by clicking "Analyze Particles" in the "Analyze" pull-down menu. Click "OK", then choose "Yes" to process all images. Save the results file.
NOTE: This will save a data file that contains the number of beads in each recorded video frame. - Open data analysis software (Table of Materials) and import the results file by clicking "Import from Text File" in the "File" pull-down menu. Plot the bead count data vs. time.
- Fit the number of beads vs. time by clicking "Curve Fit" in the "Analyze" pull-down menu. Choose the "Natural Exponent" equation and click "Try Fit" | "OK".
NOTE: Only the data recorded after the injection of sample should be included in the fitting region. The fit parameter in the exponent of the fitting function will be the cleavage rate.
Subscription Required. Please recommend JoVE to your librarian.
Representative Results
Using this technique, the SSDC rates of NdeI were measured for a range of protein concentrations (0.25–4.00 U/mL) at two different concentrations of magnesium (2 mM and 4 mM). Each of these conditions was replicated at least twice, with a few hundred to 1,000 tethered DNAs per experiment. Figure 2 describes the experimental design. Figure 3 shows examples of data collection and analysis details. Figure 4 illustrates how the rate depends on protein concentration at the two concentrations of magnesium. It can be observed that at sufficiently low protein concentrations, the rate is proportional to protein and independent of magnesium. For sufficiently high protein concentrations, the rate is dependent on magnesium but independent of protein concentration.
| Step | Description | Temperature (°C) | Time (s) |
| 1 | Denaturation | 98 | 30 |
| 2 | Melt | 98 | 10 |
| 3 | Anneal | 60 | 30 |
| 4 | Extend | 72 | 30 |
| 5 | Final Extend | 72 | 120 |
Table 1: PCR parameters. Shown are temperatures and durations of the thermocycler program steps used in step 2.2 of the protocol. The melt, anneal, and extend steps (steps 2, 3, and 4) are repeated 30x.
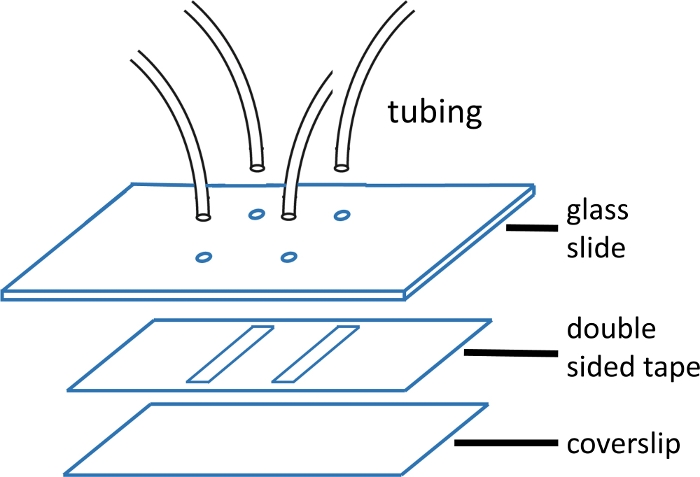
Figure 1: Microfluidic flow cell construction.
The top glass slide (2'' x 3'', 1 mm thick) is pre-drilled with holes matching the channel pattern. The inlet and outlet tubes are inserted into the holes and fixed with epoxy prior to attaching tape and cover glass. The double-sided tape is pre-cut with channel pattern. The bottom slide (#1 or #1.5 cover glass) is previously cleaned using the protocol described in the main text. Once assembled, the edge of the cover glass is sealed with epoxy. Please click here to view a larger version of this figure.

Figure 2: Experimental design.
(A) Method of DNA tethering. Double-stranded DNA (1 kbp) labeled with digoxigenin on the 5ʹ end is attached to the surface of the flow cell via antidigoxigenin-digoxigenin interaction. The 3ʹ end of the DNA, labeled with biotin, is attached to a microbead via streptavidin-biotin interaction. The NdeI cleavage site is located at the center of the DNA. (B) Experimental setup during data collection showing magnet and objective position. The permanent magnet maintains a weak upward force on the bead during the cleavage reaction. Please click here to view a larger version of this figure.
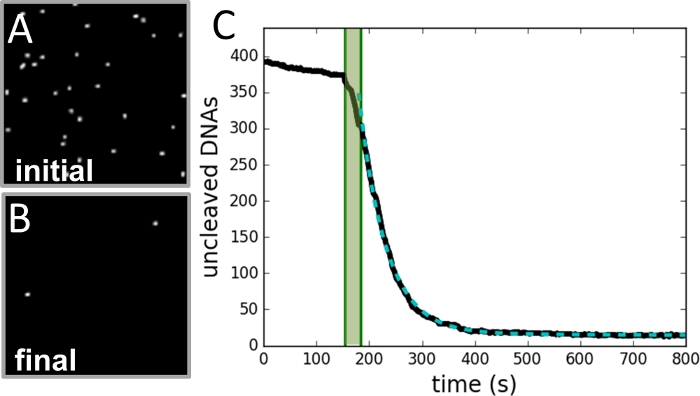
Figure 3: Example of data collection and analysis.
(A) Image of region of beads taken before cleavage reaction is initiated. (B) Image of same region after reaction is completed. (C) Plot of number of beads vs. time (black curve) as determined from each frame of the video record. The shaded green area marks the period of injection of enzyme and is not included in the fit. The data fits a single exponential curve (dashed green curve), with a decay constant equal to the reaction rate. Please click here to view a larger version of this figure.

Figure 4: NdeI cleavage is dependent on concentrations of protein and magnesium.
Plot of the measured SSDC rate of NdeI for a range of protein concentrations at two different concentrations of magnesium: 2 mM (blue circles) and 4 mM (green squares). Error bars represent SEM. The dashed curves are trend lines and do not represent fits to theory. Please click here to view a larger version of this figure.
Subscription Required. Please recommend JoVE to your librarian.
Discussion
The protocol can be used to measure the kinetics of any SSDC system, provided that the strand separation is observed during the experiment. The detection of cleavage is affected by observing the detachment of the tethered bead and therefore marks the instant of strand separation. All preceding steps occur before the detection of the cleavage; thus, only the total transit time is recorded.
The flow cell coverslip is functionalized via non-specific adsorption of antibody protein to the clean glass. Insufficiently cleaned glass may affect binding of the antibody. In tethering, bead density should be low enough so that beads do not interact. The surface density of attachment points can be controlled by the concentration of antibody during functionalization. The total number of beads depends on the size of the field of view. In this case, a few hundred to 1,000 tethered beads were sufficient for good statistics and avoided bead-bead interactions. During bead injection, surface tethering was monitored via live video. Bead injection was stopped when estimated bead count was between 500 and 1,000 beads.
The fastest cleavage rates that can be accurately measured are limited by the mixing time of the flow cell. The mixing time in laminar flow cells is influenced by several factors. Diffusion to the surface is a key step; therefore, the mixing time depends on the diffusion coefficient of the reactant. The significant shear that occurs in the entrance tubing, which transports the sample to the flow channel from the sample reservoir, can increase the time needed to ensure adequate mixing at the reaction surface in the channel. It was found that the mixing time could be reduced by reducing the upstream dead volume and increasing the flow rate. With an inner diameter of 380 µm and maximum length of 8 cm for the inlet tubing (and flow rate of 150 µL/min), it was found that the injection time could be reduced to ~20 s without affecting the measured cleavage rate. Since the mixing time depends on the diffusion coefficient of the reactant, it should be determined separately for each enzyme or cleavage activator studied.
The tethering method allows for non-specific tether rupture, presumably due to either dissociation of the digoxigenin-antibody complex or release of the antibody from the surface. This results in a reproducible background bead loss rate present before the injection of enzyme of ~3 x 10⁻⁴ s-1. This systematic effect can be corrected for either by subtracting the background rate from the measured cleavage rate, or by modeling the background in the fitting equation. However, cleavage rates lower than this lower bound will be less reliably measured.
Imperfect surface passivation can lead to improper tethering. This leads either to increased fractions of "stuck" beads, which do not go away during the the experiment, or to improperly tethered beads, which dissociate from the surface very slowly. This creates a higher and possibly sloping baseline in the processed data. It was found that with properly cleaned cover slips and freshly made β-casein stock solution, these effects were minimal for most data sets. For the occasional data sets that show this, modifying the fitting function (to include a sloping baseline) can correct for this effect.
The current protocol can be extended in several ways. Further isolation of mechanistic steps after target site binding can be performed using a pre-binding format, in which protein is injected in the absence of essential cofactors. This idea is tested by injecting NdeI in the absence of magnesium. Under these conditions, the protein binds to its cognate site but does not cleave the DNA. Injecting magnesium after this binding step activates the cleavage resulting in rapid bead loss. The experimental setup also allows for the control of DNA conformation and tension by varying the magnet configuration or adding flow. Under the low forces in these experiments, the DNA becomes partially coiled. Changing the forces slightly can have a dramatic effect on the conformation of the DNA. For example, under buffer conditions in which target search is rate limiting, varying the conformation of the DNA can test for the effect of jumping on the target search. Under buffer conditions in which the hydrolysis step is rate-limiting, varying the force can probe the effect of the DNA tension on phosphodiester bond hydrolysis. It should be noted that under the low magnification used, these conformational changes cannot be observed. The resulting small motions in bead position have to be tracked under higher magnification to verify that DNA conformation can be controlled.
Data analysis can be extended in a variety of ways. This work applies a simple bead counting method followed by curve fitting of a single exponential function. Methods based on residence time analysis can be used, as well20. Distributions of residence times of individual DNAs can then be analyzed via curve fitting or by using more sophisticated techniques, such as the generalized method of moments21.
Subscription Required. Please recommend JoVE to your librarian.
Disclosures
The authors have no conflicts of interest to disclose.
Acknowledgments
This work was supported by the National Science Foundation grant MCB-1715317.
Materials
| Name | Company | Catalog Number | Comments |
| 5 minute Epoxy | Devcon | 14250 | |
| anti-digoxigenin FAB fragments | Roche Diagnostics | 11214667001 | |
| camera and software | Jenoptik | GRYPHAX SUBRA | |
| data analysis software | Vernier Inc. | LP | |
| double sided tape | Grace Biolabs | SA-S-1L | |
| Dulbeccos Phosphate Buffered Saline | Corning | 21-031-CV | |
| ethanol 95% | VWR | 89370-082 | |
| forward primer: digoxigenin-CCAACTTAATCGCCTTGC | Integrated DNA Technologies | n/a | |
| image analysis software | National Institutes of Health | ImageJ | |
| inverted microscope | Nikon | TE2000 | |
| knife printer | Silhouette | ||
| M13mp18 DNA | New England Biolabs | N4040S | |
| MyOne streptavidin beads | Thermo Fisher Scientific | 65601 | |
| NdeI enzyme | New England Biolabs | R0111S | |
| PCR cleanup kit | Qiagen | 28104 | |
| pluronic F-127 | Anatrace | P305 | |
| polyethylene tubing PE-20 | BD Intramedic | 427406 | |
| polyethylene tubing PE-60 | BD Intramedic | 427416 | |
| Q5 Mastermix | New England Biolabs | M0492S | |
| rare earth magnet 0.5" OD 0.25" ID | National Imports | NSN0814 | |
| rare earth magnet 0.75" OD 0.5" ID | National Imports | NSN0615 | |
| reverse primer: biotin-TGACCATTAGATACATTTCGC | Integrated DNA Technologies | n/a | |
| syringe pump | Kent Scientific | Genie Plus | |
| β-Casein from bovine Milk | Sigma-Aldrich | C6905 |
References
- Tock, M. R., Dryden, D. T. The biology of restriction and anti-restriction. Current Opinion in Microbiology. 8 (4), 466-472 (2005).
- Garneau, J. E., et al. The CRISPR/Cas bacterial immune system cleaves bacteriophage and plasmid DNA. Nature. 468 (7320), 67-71 (2010).
- Pingoud, A., Fuxreiter, M., Pingoud, V., Wende, W. Type II restriction endonucleases: structure and mechanism. Cellular and Molecular Life Sciences. 62 (6), 685-707 (2005).
- Sternberg, S. H., Redding, S., Jinek, M., Greene, E. C., Doudna, J. A. DNA interrogation by the CRISPR RNA-guided endonuclease Cas9. Nature. 507 (7490), 62-67 (2014).
- Sadowski, P. D. Site-specific genetic recombination: hops, flips, and flops. The FASEB Journal. 7 (9), 760-767 (1993).
- Schatz, D. G. Antigen receptor genes and the evolution of a recombinase. Seminars in Immunology. 16 (4), 245-256 (2004).
- Craig, N. L. Tn7: a target site-specific transposon. Molecular Microbiology. 5 (11), 2569-2573 (1991).
- Gori, J. L., et al. Delivery and Specificity of CRISPR/Cas9 Genome Editing Technologies for Human Gene Therapy. Human Gene Therapy. 26 (7), 443-451 (2015).
- Urnov, F. D., Rebar, E. J., Holmes, M. C., Zhang, H. S., Gregory, P. D. Genome editing with engineered zinc finger nucleases. Nature Reviews Genetics. 11 (9), 636-646 (2010).
- Joung, J. K., Sander, J. D. TALENs: a widely applicable technology for targeted genome editing. Nature Reviews Molecular Cell Biology. 14 (1), 49-55 (2013).
- Alves, J., Urbanke, C., Fliess, A., Maass, G., Pingoud, A. Fluorescence stopped-flow kinetics of the cleavage of synthetic oligodeoxynucleotides by the EcoRI restriction endonuclease. Biochemistry. 28 (19), 7879-7888 (1989).
- Deng, J., Jin, Y., Chen, G., Wang, L. Label-free fluorescent assay for real-time monitoring site-specific DNA cleavage by EcoRI endonuclease. Analyst. 137 (7), 1713-1717 (2012).
- Becker, W. R., et al. High-throughput analysis reveals rules for target RNA binding and cleavage by AGO2. Molecular Cell. 75 (4), 741-755 (2019).
- vanden Broek, B., Lomholt, M. A., Kalisch, S. M., Metzler, R., Wuite, G. J. How DNA coiling enhances target localization by proteins. Proceedings of the National Academy of Sciences. 105 (41), 15738-15742 (2008).
- Gambino, S., et al. A single molecule assay for measuring site-specific DNA cleavage. Analytical Biochemistry. 495, 3-5 (2016).
- Jones, N. D., et al. Retroviral intasomes search for a target DNA by 1D diffusion which rarely results in integration. Nature Communications. 7, 11409 (2016).
- van Aelst, K., et al. Type III restriction enzymes cleave DNA by long-range interaction between sites in both head-to-head and tail-to-tail inverted repeat. Proceedings of the National Academy of Sciences. 107 (20), 9123-9128 (2010).
- Williams, K., et al. A single molecule DNA flow stretching microscope for undergraduates. American Journal of Physics. 79 (11), 1112-1120 (2011).
- Song, D., et al. Tethered particle motion with single DNA molecules. American Journal of Physics. 83 (5), 418-426 (2015).
- Etson, C. M., Todorov, P., Walt, D. R. Elucidating Restriction Endonucleases Reaction Mechanisms via Dwell-Time Distribution Analysis. Biophys Journal. 106 (2), 22 (2014).
- Piatt, S., Price, A. C. Analyzing dwell times with the Generalized Method of Moments. PLoS One. 14 (1), 0197726 (2019).
